


Economic Outlook
US Growth Appears to Slow; Inflation Remains Challenging
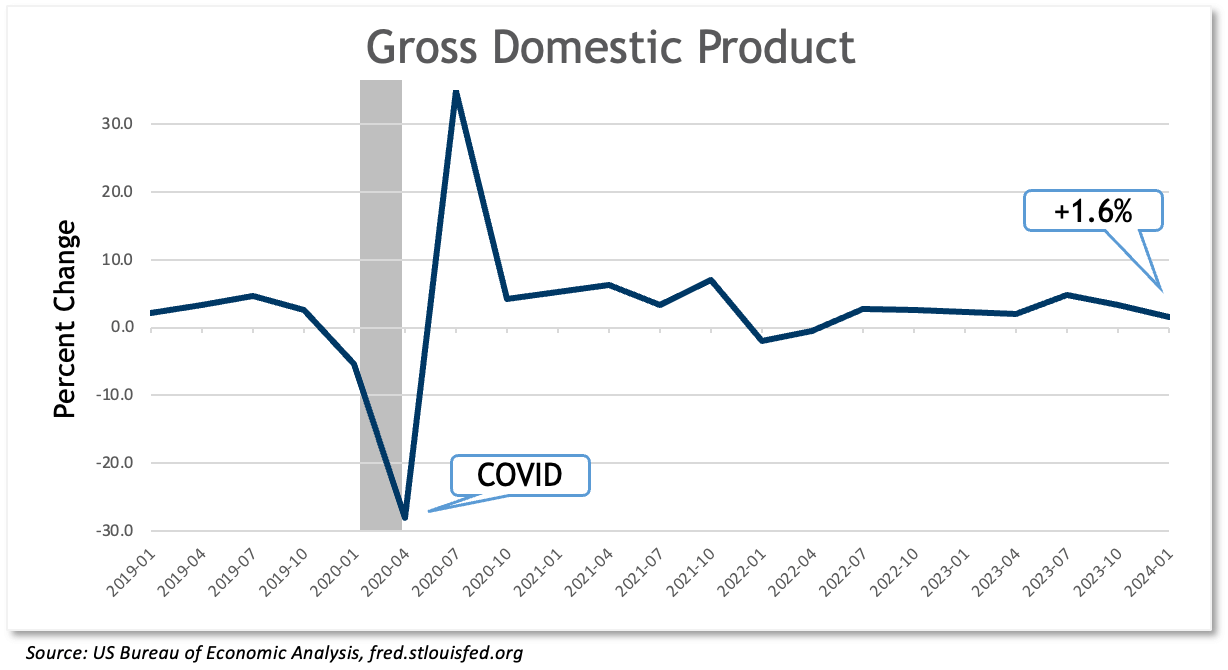
- Real GDP grew 1.6% in Q1
- Some drivers of growth stronger than headline
- Inflation stuck, based on broad measures
- Labor market shows some slack
Growth
Growth in the US economy slowed to 1.6% in the first quarter, as measured by Real GDP. US Growth was measured at 3.4% in the fourth quarter of 2023. The weaker initial estimate of growth during the first quarter masked some underlying and continuing strength. The first-quarter number was impacted by trade and inventories, both of which had the effect of reducing the overall estimate of growth. However, consumer spending, which is a broader and more consistent driver of the US economy, held up at 2.5% in the first quarter, and spending on services actually accelerated. Consumer spending on services increased at an impressive 4% rate, even as spending on goods declined. Spending on durable goods was down 1.2%.
While the headline growth number was a disappointment (growth had been estimated at 2–2.5%), the overall estimate was reduced by the more volatile and peripheral components of trade and inventories. Inventories declined 0.35%, and imports, which offset GDP, rose 7.2%. Real final sales to private purchasers, which excludes the impact of trade and inventories, increased 3.1%. That number has been above 3% for the past three quarters. The consumer is keeping this economy motoring along. However, there is evidence in these numbers of the impact of higher rates—spending on durable goods, which are more likely to be financed, is down. And there is some evidence that the consumer is being stretched by all this spending. The personal savings rate slipped to 3.6% (the norm is about 7%), and both credit card balances and delinquencies are increasing. Reflecting these increasing economic stresses, consumer confidence has been trending down. The US consumer, the key driver of the US economy, came through again in the first quarter, but that source of strength may start to fade as higher rates bite, inflation erodes purchasing power, and savings are spent down.
Employment
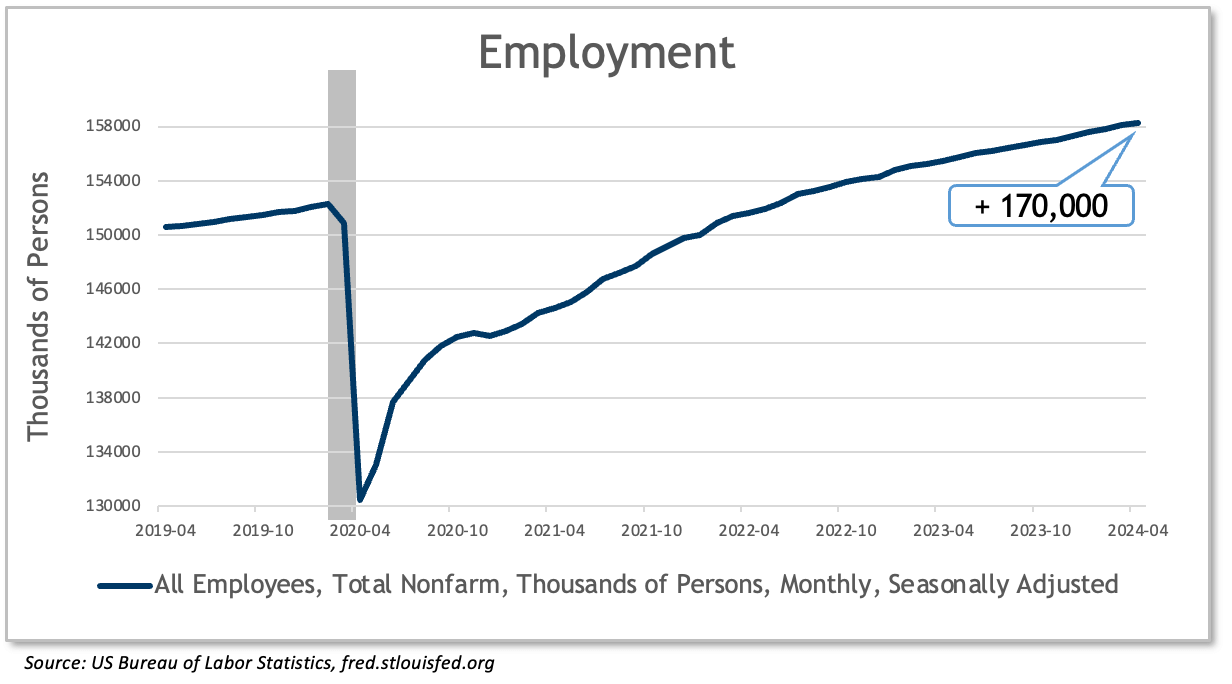
- 175,000 jobs added in April, lowest in months
- Unemployment ticked back up to 3.9%
The US economy added 175,000 jobs in April, a marked decline from recent months. Increases in payrolls had been averaging over 250,000 for the past four months. Other measures also indicate that there may be some softening in the labor market. Job openings declined to 8.5 million in March; they were at 9.6 million one year earlier. The quit rate declined to 2.2%, and job postings and hiring plans were also down. While far from recessionary, the jobs market is not nearly as tight as it has been during most of this recovery. Total compensation costs continue to expand at 4.2%, but that rate is down from over 5% as recently as last year. Overall, the employment picture is improving for businesses looking to hire, and the cost of labor is contributing less to overall inflation than it has been since the COVID recession. Furthermore, productivity is improving. Nonfarm productivity growth was up 2.9% in the first quarter of 2024. The productivity of the American worker has been improving over the past year, and this change is significant in the current environment because productivity can be a powerful antidote to inflation. If inflation describes an environment where the consumer pays more and gets less, improving productivity describes an economy that produces more relative to the unit cost of labor. This picture should continue to improve if wage inflation continues to come down and may improve significantly if Artificial Intelligence creates efficiencies in a growing number of industries.
Inflation
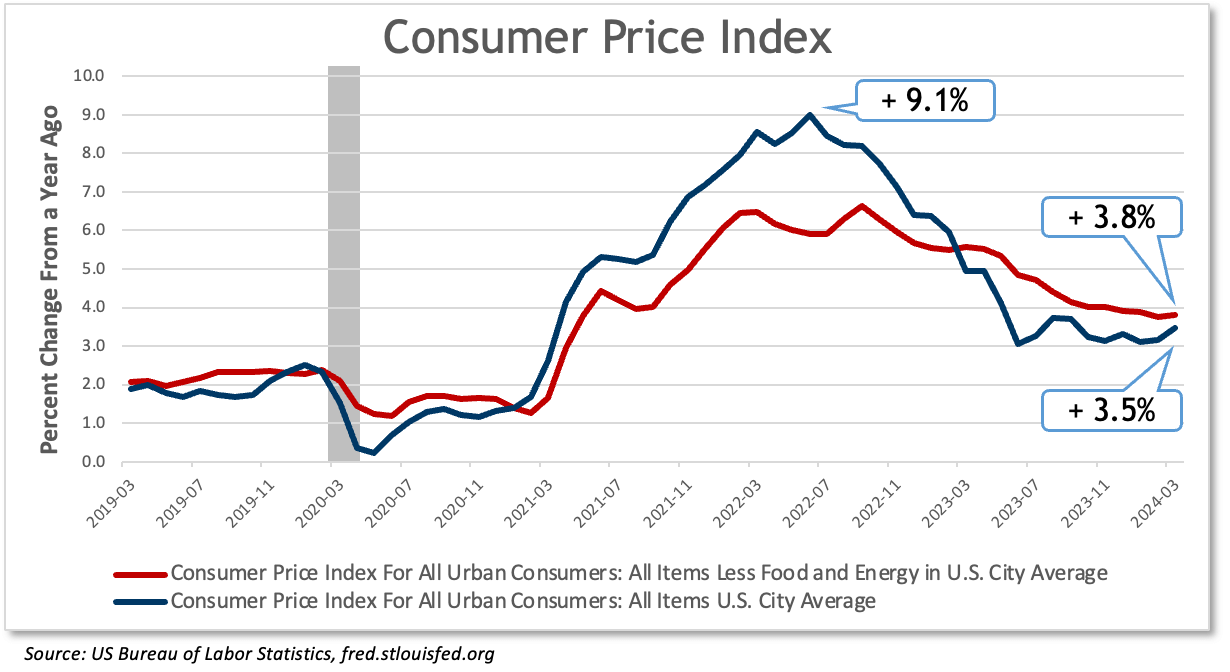
- The battle against inflation is now a grind
- “All items” CPI increased 3.5% in March
- Core CPI at 3.8% appears to have leveled off
- Road down to 2% proving tougher than anticipated
Inflation is the core economic issue for policymakers in the US economy. The battle against inflation, which had shown real progress during most of last year, now appears stalled, at least based on the headline numbers. The broad CPI measure of inflation has been up in both of the last two months, and “core” CPI, which excludes food and energy, appears stalled. A few key factors are making further progress on inflation difficult. First, the repair of supply chains was an important factor in the first phase of an improving inflation picture following its peak in July 2022. The COVID recession, and its lockdowns, impaired global supply chains and created scarcity in many critical materials and components. That scarcity triggered price increases. The subsequent repair of the supply chains was a disinflationary force during most of last year. Since that process has now run its course, there will probably be no further gains in the inflation battle attributable to supply improvements. Second, declining energy prices helped the overall inflation picture during most of last year. With oil now below $80 per barrel, it is doubtful that energy can repeat that performance and drive the inflation rate still lower this year.
The core PCE deflator, the Federal Reserve’s preferred measure of inflation, was up 2.8% in March and also appears stalled. Behind the headline numbers, there is some evidence of grinding progress on inflation. Rents to new tenants are either down or increasing at a slower rate. The rate of increase in the total cost of labor has declined. Some of the most recent inflation is connected to rate increases on insurance, which are not rate-sensitive. Further progress on inflation will be much tougher and much slower than it was during 2023.
Interest Rates
- Fed in no hurry to cut rates
- Not inclined to increase policy rates further
- Fed balance sheet contraction to slow
The Federal Reserve’s Open Market Committee met on April 30 and May 1. At that meeting, they held their target for overnight rates steady at 5.25–5.50%. They also indicated that they may stay on hold for some time to come. Their next meetings will be on June 12 and July 31. Few analysts expect them to make any rate changes at either of those meetings. The Fed continues to pause any rate action because it is not presently seeing the kind of progress on inflation that would motivate a rate cut. Neither is it seeing a surge in unemployment that might motivate the same action. Since overall growth in the economy continues, albeit at a slower pace, the Fed sees no urgency to begin the process of lowering interest rates. Unless one of these facts changes, it is entirely possible that the Fed will remain on hold for many more months, and perhaps even through the end of 2024. Many analysts had forecast six rate cuts this year, beginning in March. However, the battle against inflation has deteriorated into one long grind.
Some commentators have written of the possibility of additional rate increases from the Fed, but Chair Powell seemed to almost rule those out during his comments to the press following the most recent meeting. The Fed believes that the current monetary environment is restrictive enough to address the inflation problem if given sufficient time to work. The bottom line is that the Fed will hold rates where they are until there is either an improvement in the inflation outlook or a meaningful increase in unemployment. A decline in growth to recessionary levels could also force their hands, but that would almost certainly show up in one of those other measures.
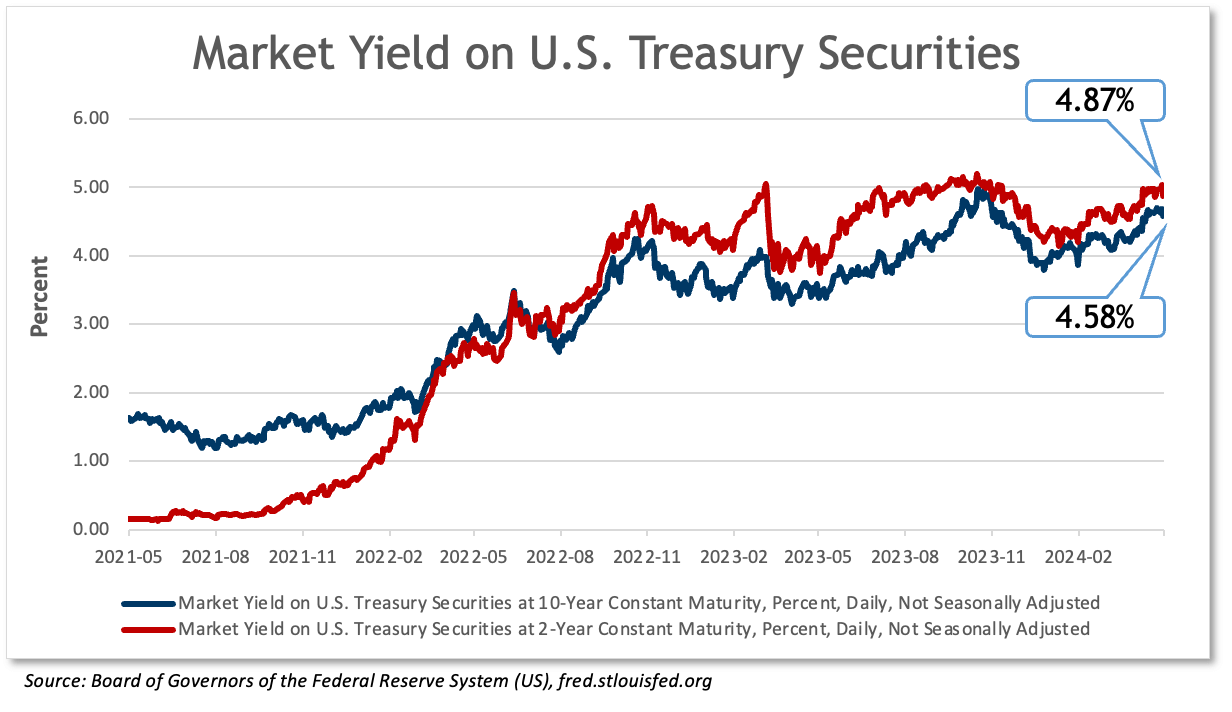
Intermediate bond yields have gone up on the realization that the Fed will be holding rates “higher for longer.” The yield on the 10-year Treasury note went from 4.09% in early March to 4.50% at this writing. Many key interest rates charged on loans are pegged to the 10-year Treasury.
The Fed has been allowing $95 billion of assets it holds on its balance sheet to “run off” every month. They do this by allowing some of the billions in bonds they hold to mature without rolling the proceeds back into Treasuries and agency bonds. This has the effect of reducing the amount of cash available to the financial system. Like higher rates, this action is intended to slow growth and inflation. Interest rates measure the cost of capital; liquidity measures its availability. Following the most recent meeting, the Fed indicated that it would begin to slow the runoff of bonds that it presently holds. All things equal, slowing the runoff in its bond holdings will lessen the rate at which the Fed withdraws liquidity from markets. They are doing this not because they want to relax their efforts to combat inflation, but because they want to begin an orderly transition to a less restrictive monetary environment. Abrupt changes to liquidity can be destabilizing to markets.
Markets
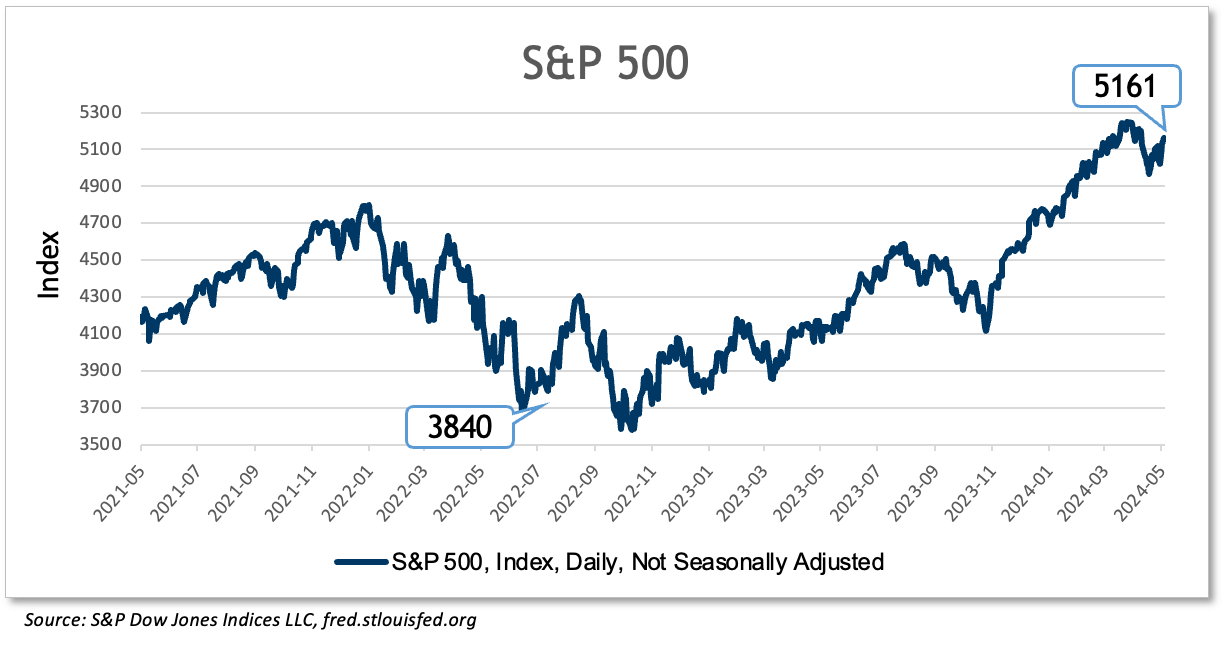
- S&P 500 stalls after brisk rally in Q1
- Bond market adjusting to “higher for longer”
The S&P 500 gave back some ground in April after rising over 10% during the first quarter of 2024. In April, the index lost almost 4%, but it is still up 7.5% YTD at this writing, having regained some ground in early May. Most companies are reporting solid earnings, although many business leaders are expressing caution about the outlook for the remainder of this year. Valuations remain very high, but the performance leadership in the stock market has spread out somewhat from the “magnificent seven” of 2023.
Yields on bonds have reversed and headed up, after over-anticipating rate cuts at the beginning of the year. The 10-year Treasury yields 4.5% at this writing, after breaking below 4% in the first months of the year. The 2-year note is at 4.81% after dipping to 4.2% in January. The yield curve remains inverted, though less so than last year. It has now been inverted—with short-term yields higher than long—for the longest period in history. An inverted yield curve is not a “natural” condition, as investors typically expect to be paid more in exchange for investing their money for longer periods. In the present instance, it is, in part, a product of the steepest and fastest rate increases in decades. In the past, an inverted yield curve has been a reliable predictor of recession.
Despite our higher interest rates, the bond market may not have fully priced America’s exploding deficit and debt. In 1992, America’s debt stood at 46% of GDP, and today, it is 96% of GDP. For the past five years, under two very different administrations, the federal deficit has averaged 9% of GDP. Every dollar of deficit spending adds to the debt. Every dollar that services that debt adds to the deficit. Sadly, neither the electorate, nor our political leadership, seem too preoccupied by the long-term threat to American prosperity that stems from fiscal mismanagement. In fact, it is possible that this problem gets worse regardless of the outcome of this year’s election. If the Democrats win, it may get worse through increased spending, and if the Republicans prevail, it may get worse through tax cuts. This problem only gets addressed if and when voters demand it.
In the face of some real challenges, the US economy continues to do surprisingly well. Expanding GDP, low unemployment, and rising earnings are all strong drivers in this economy. However, inflation is still alive and well, interest rates are close to their peak, and federal spending continues apace. Perhaps for these reasons, consumer attitudes appear to be in a bit of a funk. Yet still we spend.
If we can help or provide additional information; please do not hesitate to contact us.
Learn about our economy expert.

-
This information is for informational purposes only and does not constitute investment advice.
Sources:
GDP – Bureau of Economic Analysis
Employment & Inflation – Bureau of Labor Statistics
Interest Rates – Federal Reserve
P/E S&P 500 – multpl.com
Non-Deposit investment products and services, and Insurance products and services offered through United Community Banks, Inc. are:• NOT Insured by FDIC or Any Other Government Agency;
• NOT Guaranteed by United Community Bank or any affiliate of United Community Bank;
• NOT a Deposit or Obligation;
• Subject to Risk and May Lose Value
This content is not intended as, and shall not be understood or construed as, financial advice, investment advice, or any other advice. This content is provided for informational purposes only, without any express or implied warranty of any kind, including warranties of accuracy, completeness, or fitness for any particular purpose. United Community shall not be liable for any damages of any kind relating to such information not as to the legal, regulatory, financial or tax implications of the matters referred herein. All views and opinions expressed are those of the writer/commentator and do not reflect the views or positions of United Community.