


Economic Outlook
A “Risk Management” Cut to Interest Rates
- The Fed cuts in response to job slowdown
- US growth remains positive; however, at a slower pace
- Inflation appears stuck above 2%
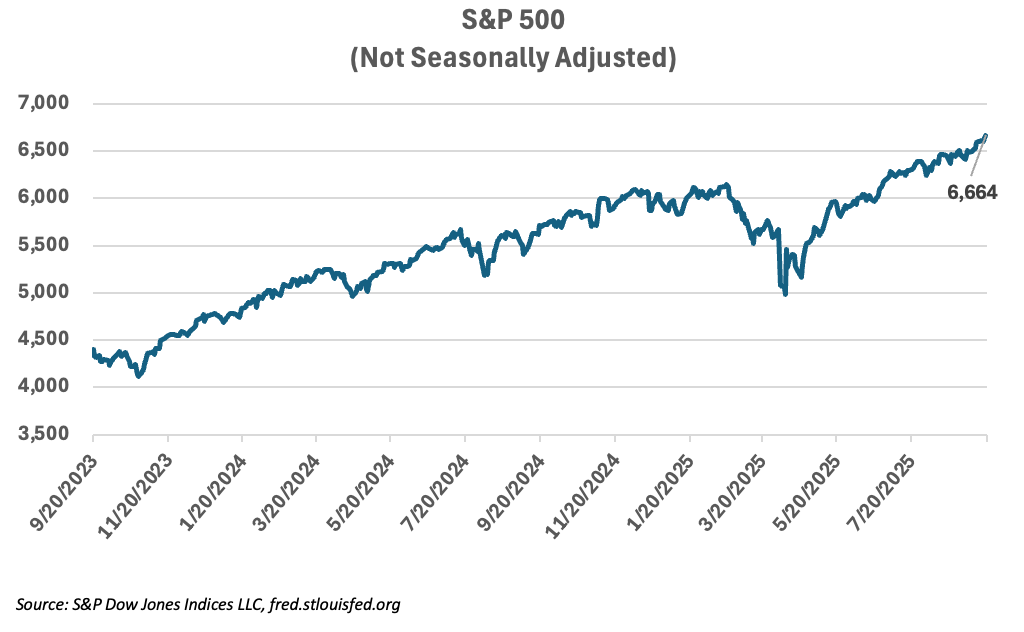
- Stock market finds new highs
Growth
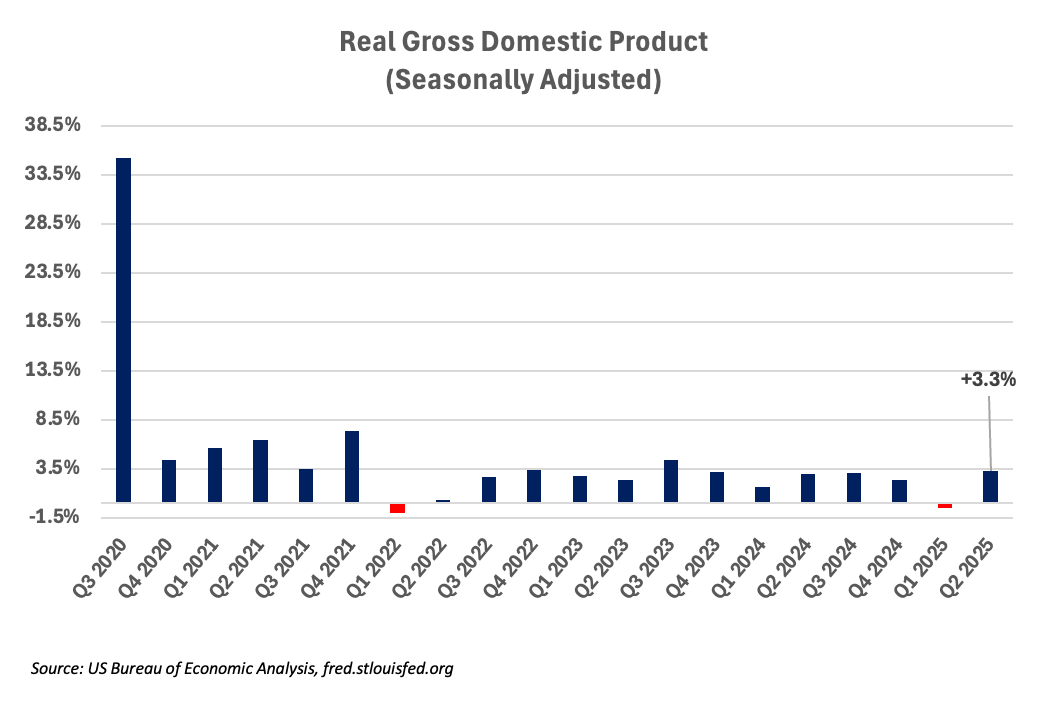
US real GDP rose a strong 3% in the 2nd quarter
GDP had declined 0.5% in the first quarter
US economy continues to grow; however, at a slower rate than 2024
Personal consumption accelerated in Q2
As the US economy enters the final quarter of 2025, it faces two significant and opposing forces. Inflation remains stubbornly above the Fed’s 2% target, and job growth has slowed to a pace of less than 30,000 per month. Policymakers, including the Federal Reserve, have chosen to shift the focus of their attention from inflation to the slowdown in job growth, concerned that the slowdown in employment could morph into a slowdown in the overall economy. In response, the Fed implemented a 0.25% cut to short-term interest rates and signaled more cuts may be on the way. Futures markets are projecting another two cuts for 2025 and two more in 2026, for a total of 1.00% projected reduction in short-term rates.
During the first half of 2025, the balance of risks in the US economy appeared tilted toward inflation. Inflation, as measured by CPI, never got below the Fed’s 2% target and has been increasing since April. There was an additional concern that newly imposed tariffs, which are paid by importers and consumers, would add to inflationary pressures during the second half of the year. However, recent revisions to the models used to estimate US payrolls indicate that job growth has been much slower than previously reported. Policy focus has now shifted to ensuring that overall growth in the economy does not stall during the remainder of the year.
Growth in the US economy, as measured by real GDP, contracted 0.5% in the first quarter and then grew by an impressive 3.3% in the second quarter, based on the headline numbers. However, both GDP numbers were significantly distorted by unusual trade activity related to the imposition of new import tariffs. Growth in the US economy is not as weak as indicated by the first quarter GDP number and it is not as strong as suggested by the second quarter number. The calculation of GDP includes an adjustment for trade—net imports are a subtraction from overall GDP, so when imports surge, GDP declines, and when imports decline, GDP will rise, all else being equal.
US businesses accelerated imports in the first quarter in order to get ahead of the new tariffs announced on April 2 of this year. In the first two quarters of this year, net imports had the biggest impact on overall GDP ever recorded. Imports were responsible for a negative 4.6% adjustment to the overall estimate of growth in the first quarter and a positive 5% adjustment in the second quarter. This, in an economy that is growing at a less than 3% trend rate. If we take both GDP numbers and the sales activity for the first half of the year into account, we arrive at an estimated US growth rate of 1.2–1.5%. This is a positive but slow rate of growth when compared to the 2.9% and 2.8% growth rates from 2023 and 2024, respectively.
Retail sales, which are an important indicator of growth in a consumer-driven economy, rose 0.6% in August versus July. Sales have risen over each of the past three months. Retail sales are not adjusted for inflation, so some of the growth in sales is attributable to price increases. Nevertheless, sales beat expectations. Car sales helped push up that number—electric vehicle sales may have benefited from the anticipated expiration of tax credits later this month, and overall motor vehicle sales may still be benefiting from some front-running of tariffs, as well as the seasonal turnover of model-years. Overall growth in manufacturing has been muted, but we have seen some growth in high-tech, chemicals, and aerospace. Manufacturing PMI remained in contraction for August, although the “New Orders” measure showed modest growth. PMI for services showed solid growth in August, and services comprise a larger portion of the US economy. Personal income continues to grow at a rate supportive of consumer spending, however, consumer confidence is also being negatively impacted by inflation expectations. Consumer spending is the most important driver of growth in the US economy, and it appears to be holding up reasonably well in the face of inflation and employment pressures.
Housing continues to be impacted by high mortgage rates. New home sales declined 0.6% in July and are now down 8.2% year-over-year. Existing home sales ticked up in July but are essentially flat year-to-date. Multifamily starts have also been in a downward trend for the past year.
Employment
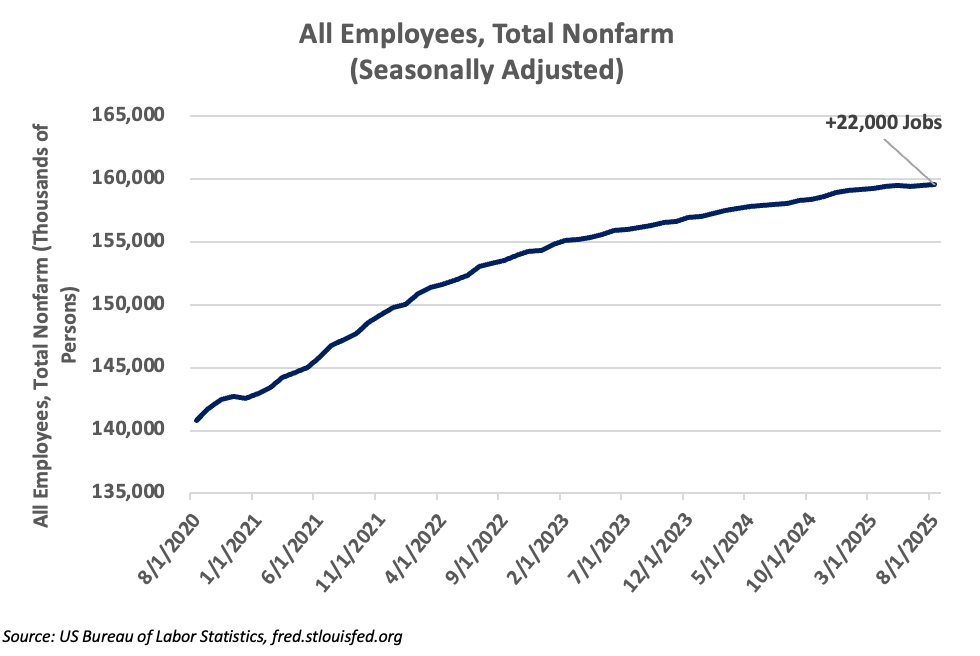
- Payrolls increased by only 22,000 in August
- Job growth has averaged below 30K for the last four months
- Unemployment ticked up to 4.3%
The US economy added only 22,000 jobs in August. The average monthly additions to payrolls are now below 30,000 for the last three months. Monthly payroll additions can be volatile; however, the US added 71,000 jobs in August of 2024. Unemployment reached 4.3%—not high in historical terms, but still a new high for the current cycle. Unemployment got as low as 3.5% in 2022 and again in 2023. Enforcement of immigration laws is impacting the supply side of labor, while policy uncertainty and moderating growth is impacting the demand side. At the same time, workers are holding on to their jobs, so job turnover has been low. Both job openings and separations have been in gradual decline—businesses are not shedding jobs, and workers are not switching jobs at the rates indicated in earlier reports. This dynamic has been referred to as the “no hire, no fire economy.”
The employment situation was the most important factor in the Fed’s decision to cut rates and marks a shift in the balance of risks facing our economy. In cutting rates, the Fed has signaled that it is at least as concerned about slowing economic growth as it is about inflation.
Inflation
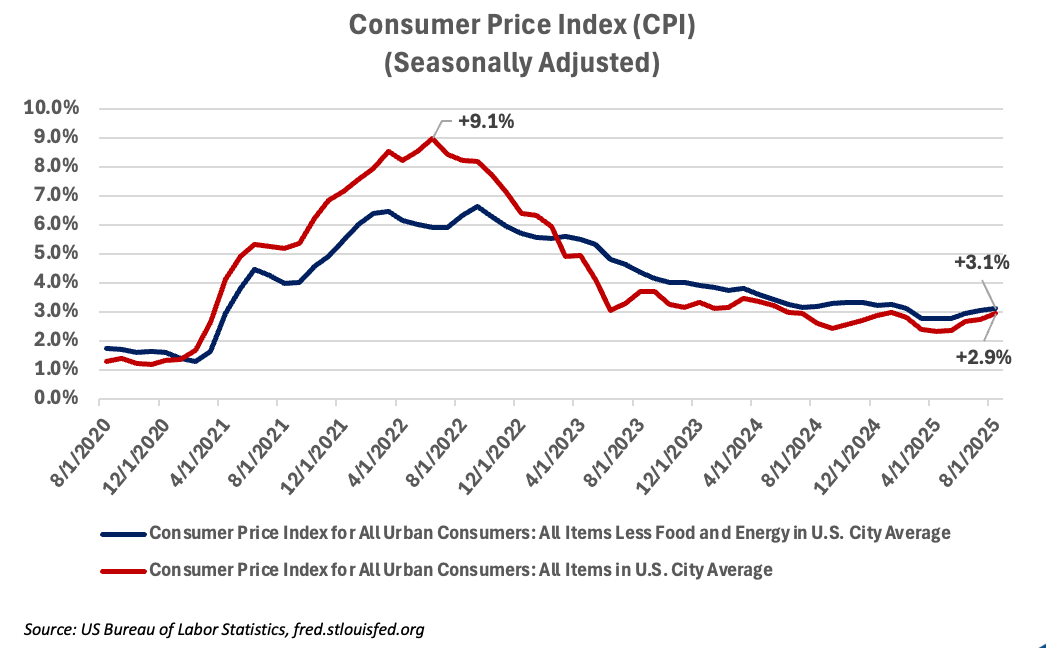
- Both “Core” and “All Items” CPI ticked up in August
- August headline CPI was 2.9%
- Core CPI was 3.1%
- Tariff impact appears muted and perhaps delayed
For the 12 months ending in August, CPI inflation was 2.9%. Both core and headline inflation were higher in August than in July. Core CPI (ex food and energy) was up 3.1%. Housing was a significant factor in the increase in inflation in August at 0.4%; however, food was also up 0.5% month over month. Piped gas ticked down in cost for the month but has been up by double digits over the past year. Overall, energy was up 0.7% and gasoline rose 1.9% in August. Airfares, used cars and trucks, clothing, and new vehicles all contributed to rising prices. Continuing dollar weakness against other currencies is also contributing to price pressures on imported commodities and finished goods.
One study estimates that tariffs are currently adding about 0.3% to the rate of inflation, however, it also stands to reason that the full effect of the new tariffs have not yet found their way through to final sales. Profit margins were strong at the beginning of the year, so some of the effects of tariffs may have been absorbed by importers. Even so, we anticipate that the impact of higher import duties will continue to contribute to inflation through at least the end of the year.
Interest Rates
- The Federal Reserve cut rates 0.25% on September 17
- Short-term target rate cut to 4.00%–4.25%
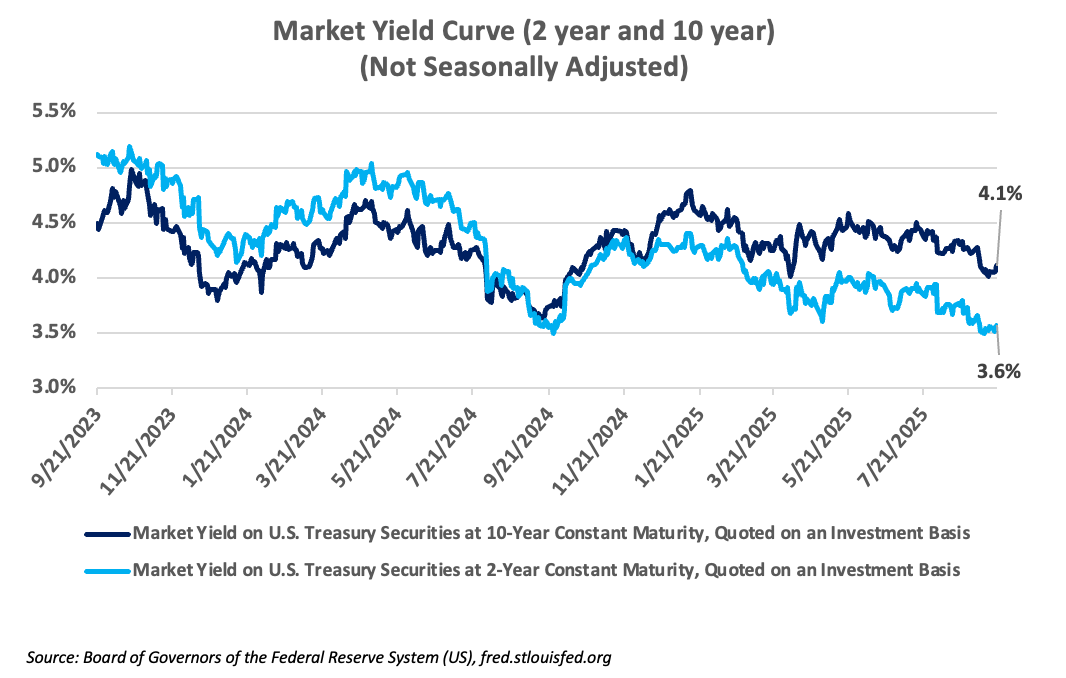
- Key 10-year Treasury rate is at 4.13%
The Federal Reserve’s Open Market Committee met on September 16 and 17 and cut its target for short-term interest rates by 0.25%. It was a widely anticipated move. Chair Powell referred to the cut as a “risk management” action. Clearly, the Fed has shifted its focus away from inflation and more toward the declining rate of job growth. The risk they are concerned with managing is the risk that declining job growth leads to a more general decline in economic growth. Although Chair Powell emphasized that any future rate decisions would be “data dependent,” the futures markets are pricing in another two cuts for 2025 and two more for 2026. This would imply that we may see overnight rates in the range of 3.00–3.25% in 2026. The three-year Treasury yield is 3.56%, so the current shape of the yield curve would also seem to anticipate additional rate cuts.
Although markets welcomed the rate cut, it remains to be seen just how stimulative such cuts might be for the broad economy. The Fed exercises enormous influence over short-term rates but has much less control over longer-term rates. Most credit rates, such as 30-year mortgages, are indexed to the 10-year Treasury yield, and this rate remains above 4.00%. The Fed has tools which it could use to influence longer-term rates, however, outside of wars or financial crises, it has very rarely used those tools. It may be reluctant to use such tools in the present environment out of concern that doing so might signal deeper concerns about the strength of the US economy. Our ongoing fiscal deficit requires the US Treasury to borrow billions of dollars every year, and the ongoing need to market bonds to finance the deficit is practically forcing the bond market to demand higher rates on intermediate bonds.
Markets
- Stocks keep finding new highs
- Valuations are stretched
- International stocks also strong
- Bond yields are attractive
The S&P 500 is up 13.3% YTD on price action alone. Earnings have been supportive and have generally come in at or above estimates. The S&P 500, the small-cap Russell 2000, and the Nasdaq have all risen to new record highs in recent weeks. Third quarter earnings growth for the S&P 500 is forecast by analysts to come in at 7.7% (YOY). This would be a lower rate of earnings growth than we have seen over most of the past year, but it would also represent the ninth consecutive quarter of positive earnings growth. At current price levels, investors are paying more for each dollar of earnings than in the past. The forward price-earnings multiple of the S&P 500 stands at 22.6x versus a ten-year average of 18.5x. At its post-COVID low, the price-earnings multiple was 20x.
International stock indexes, which have lagged their US counterparts for the last several years, have outperformed domestic stock indexes in this volatile environment. The MSCI World index is up 17.4% YTD. Valuations on many international stocks are more reasonable, too. Investors seeking diversification may want to maintain exposure to international stocks.
The US dollar continues to decline. The DYX index is down 10% YTD, so some of the differential between US and international returns is attributable to dollar depreciation. This depreciation is occurring in spite of the fact that interest rates in the US are still higher than in many other developed countries. Cash flows indicate that international investors continue to invest in US stocks, however, an increasing portion of those investments are being hedged against dollar weakness.
In this environment, the price of gold has also found new highs. It recently traded at $3687 per ounce and is up over 40% YTD. Gold has now eclipsed its prior highs, even on an inflation-adjusted basis. Gold only occasionally outperforms stocks, but it tends to do well in an environment characterized by inflation and geopolitical instability.
Real interest rates on bonds (the yield above the rate of inflation) are holding at attractive levels. Investors seeking preservation of capital can earn interest at rates above the pace of inflation, a condition not seen in the ultra-low-rate environments following the financial crisis and COVID. One index of high quality 5-year corporate bonds currently yields over 4.6%, and the Bloomberg US Aggregate bond index is up 3.9% YTD. Furthermore, since bond values move in the opposite direction of interest rates, if rates do come down in the future, bond portfolios could also appreciate.
If we can help you navigate this changing business climate, please do not hesitate to contact your United Community banker. We appreciate your readership.
-
This information is for informational purposes only and does not constitute investment advice.
Sources:
GDP – U.S. Bureau of Economic Analysis via FRED®
Employment & Inflation – U.S. Bureau of Labor Statistics via FRED®
Interest Rates – Board of Governors of the Federal Reserve System (US) via FRED®
S&P 500 – S&P Dow Jones Indices LLC via FRED ®
Market data – YCharts
Non-Deposit investment products and services, and Insurance products and services offered through United
Community Insurance, an independent insurance agency, are:- NOT Insured by FDIC or Any Other Government Agency;
- NOT Guaranteed by United Community Bank or any affiliate of United Community Bank;
- NOT a Deposit or Obligation;
- Subject to Risk and May Lose Value
This content is not intended as, and shall not be understood or construed as, financial advice, investment advice, or any other advice. This content is provided for informational purposes only, without any express or implied warranty of any kind, including warranties of accuracy, completeness, or fitness for any particular purpose. United Community Bank shall not be liable for any damages of any kind relating to such information not as to the legal, regulatory, financial or tax implications of the matters referred herein. All views and opinions expressed are those of the writer/commentator and do not reflect the views or positions of United Community Bank. United Community Bank provides investment, administrative, and trustee services to customers of United Community Bank