


Economic Outlook
Tariffs and Turmoil
- GDP prints negative, details less alarming
- Hiring remains strong
- Interest rates rise with the 10-year Treasury yield
- Inflation showing some improvement
Growth
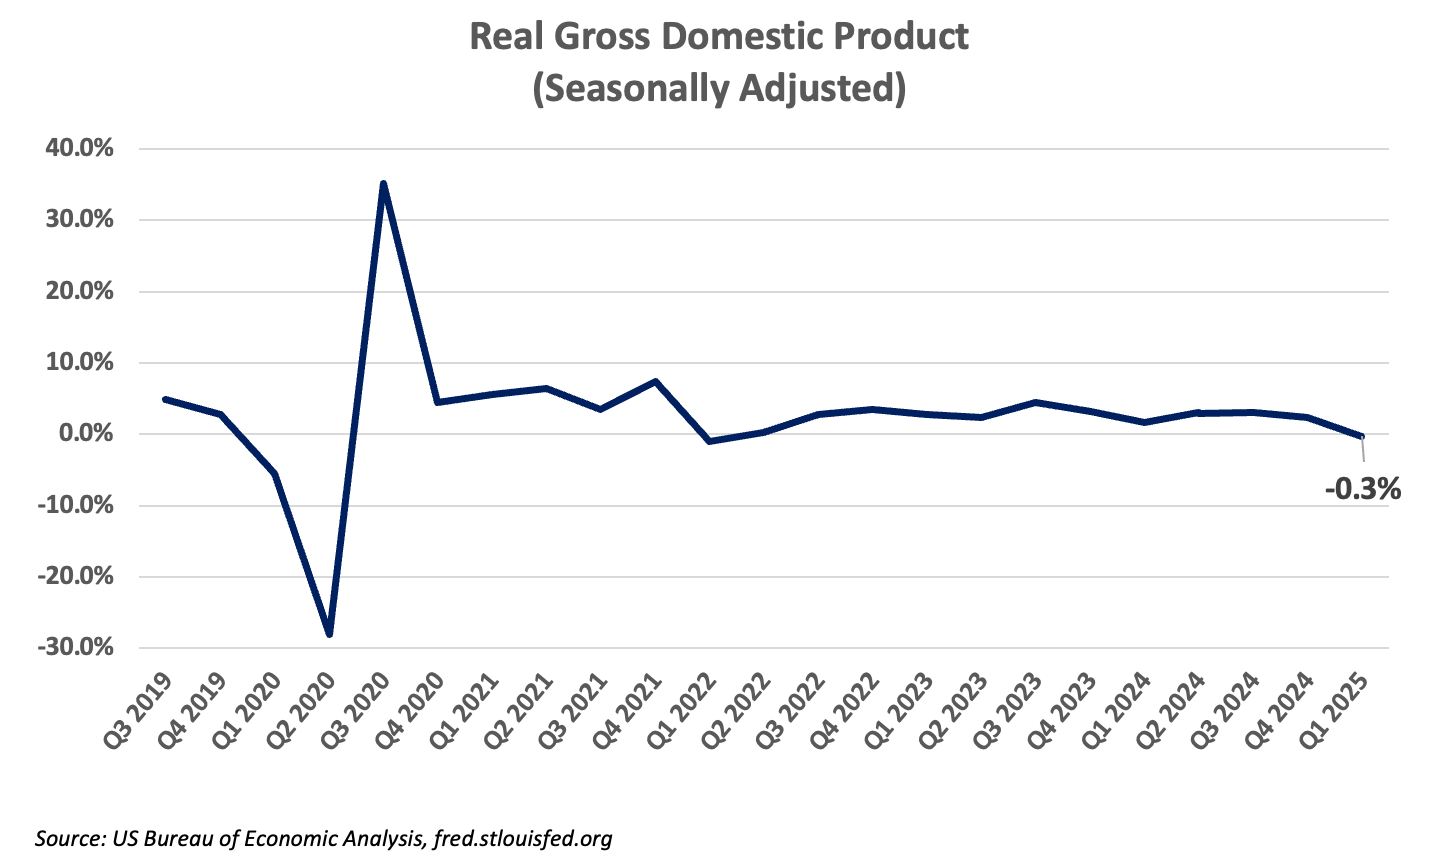
- US real GDP contracted 0.3% in Q1 2025
- Imports are the main reason for the headline result
- Sales indicate continuing growth at a slower rate than in 2024
- Personal income and labor market remain strong
After growing 2.4% in the fourth quarter of 2024, US real GDP contracted 0.3% in the first quarter of 2025, according to the first estimate (there are three). While the headline number indicates a sharp break from growth in the prior period, there are very specific reasons why GDP went negative in the first quarter. The most important of these was a dramatic expansion in imports. Net exports are a subtraction from GDP, so the abrupt increase in imports was enough to shave over 4% from the overall GDP result. US businesses rushed to import goods ahead of proposed tariffs, and this import activity resulted in the negative overall result. Consumer spending, a key driver of the US economy, grew 1.8%. Growth in consumer spending slowed compared to last year but was still solidly positive.
We would caution against reading too much into the negative headline number in this preliminary result; subsequent estimates may revise the GDP number more than usual. For one thing, we would have expected the increase in imports to have been somewhat offset by an increase in inventories, which would have raised GDP. Not all of the imports would have flowed through to final sales, as some would have been stockpiled. However, the change in inventories only added 2.25% back to GDP. “Real final sales to private purchasers” represents a broader indicator from this report, and that number rose 3.0%. The threatened tariffs have created turmoil in markets and some noise in the economic reports.
Federal government spending contracted 5.1%, with most of the contraction coming from defense spending. State and local government spending expanded by less than 1%. Federal spending is 23% of US GDP, so reductions in this area can impact overall growth. Some of the decline may be attributable to the cost-cutting efforts of DOGE, but we are still early in that process.
Our overall conclusion is that the US economy is still slowing relative to last year. Personal incomes are up, consumer spending grew, albeit at a slower pace, and considerable activity was pulled forward in anticipation of tariffs. Negative results on GDP can signal the beginning of a recession. However, it would be premature to read that into this report. Surveys and earnings calls confirm that there is a great deal of uncertainty stemming from new policy actions, and uncertainty can be a self-fulfilling drag on the economy. It would take a marked increase in unemployment and a slowdown in consumer spending to signal a recession. Of course, sometimes these are only clearly visible after the fact.
Employment
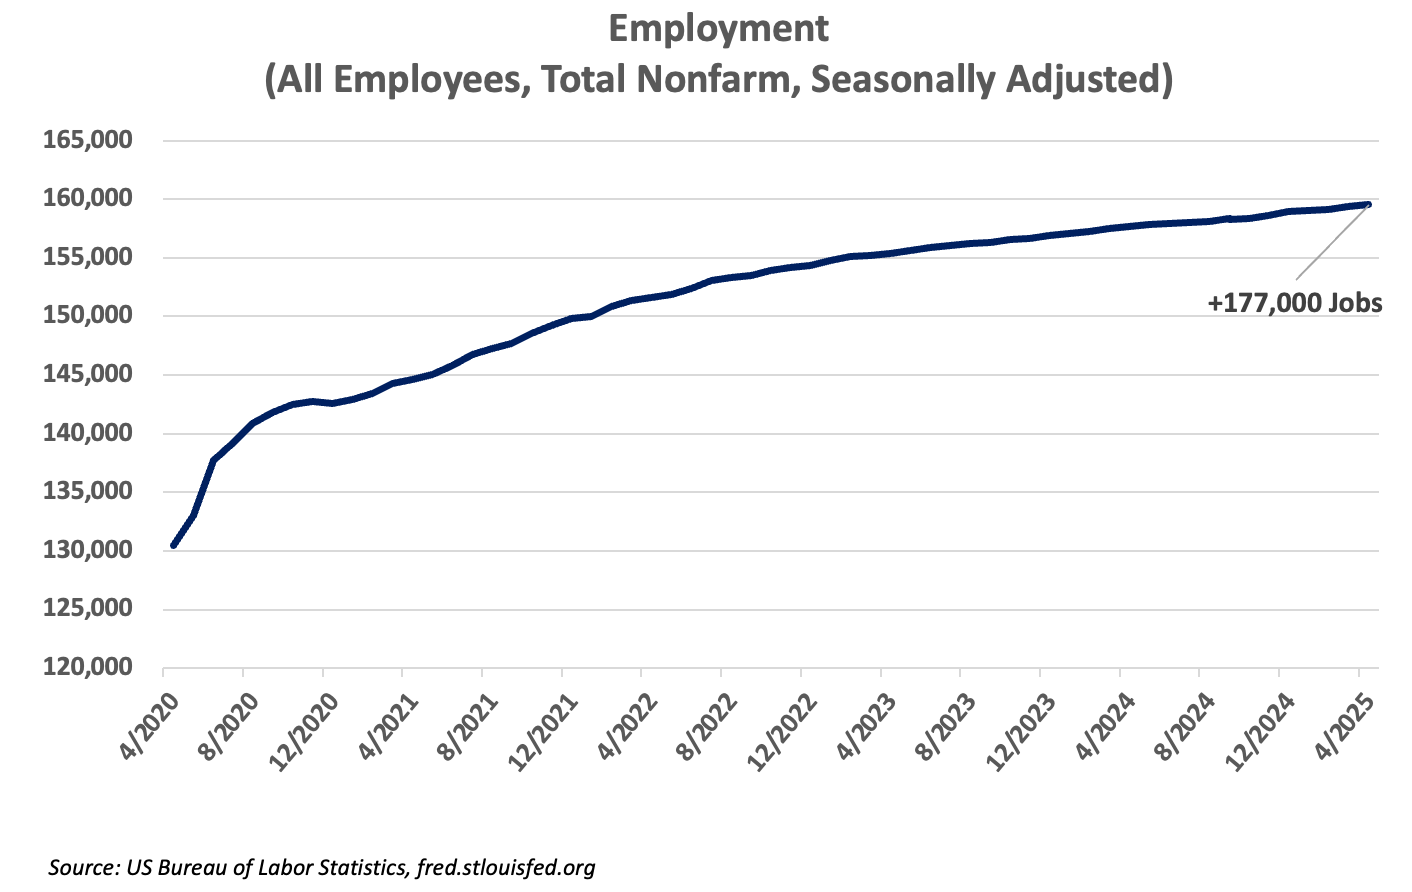
- Payrolls increased 177,000 in April
- Unemployment was flat at 4.2%
- Wage increases continue to be moderate
The US economy added a solid 177,000 jobs in April and has now averaged 155,000 over the last three months. There is evidence elsewhere of the economy slowing, however, we see few signs of that in the job numbers. Unemployment has gradually moved up from 3.4% two years ago but still remains low at 4.2%. Wage increases have held to a level that will not contribute appreciably to inflation. Reported job openings have declined to 7.2 million and are roughly equivalent to the number of unemployed workers. Job openings stood at 9.5 million one year ago. With respect to employment, any evidence of a slowdown is showing up primarily in the lower number of open positions, rather than in the number of unemployed.
Inflation
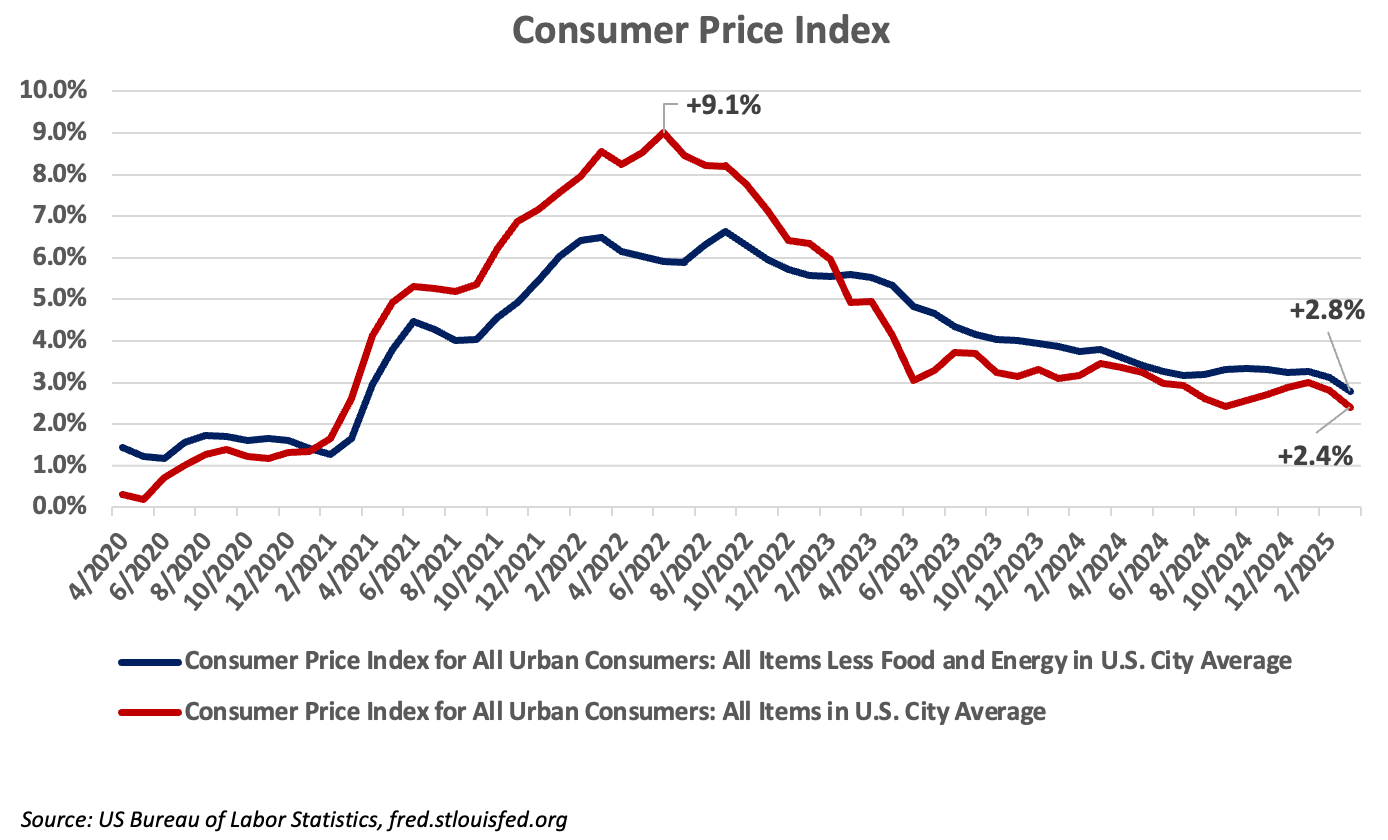
- March CPI is lower than February at 2.4%
- Core CPI came in at 2.8%
- Inflation improving, but still above 2%
The month-over-month Consumer Price Index for March actually decreased 0.1%. For the 12 months ending in March, CPI inflation was 2.4%. This is the smallest 12-month increase since March of 2021. Declines in energy prices, especially gasoline, helped lower the inflation rate. Larger increases are still being recorded for food and housing. This is one of the more encouraging inflation reports we have received in a while.
Expectations for inflation and the consumer’s perception of inflation remain elevated because prices remain elevated. Inflation only measures the rate of change in the overall price levels, not price levels themselves. Inflation has moderated a great deal since hitting 9% halfway through 2022, but for now, it remains above the Fed’s 2% target. New tariffs will add to the cost of imported goods and the cost of domestic products that incorporate imported parts or materials.
Interest Rates
- Federal Reserve faces a dilemma
- Short-term target rate held at 4.25%–4.50%
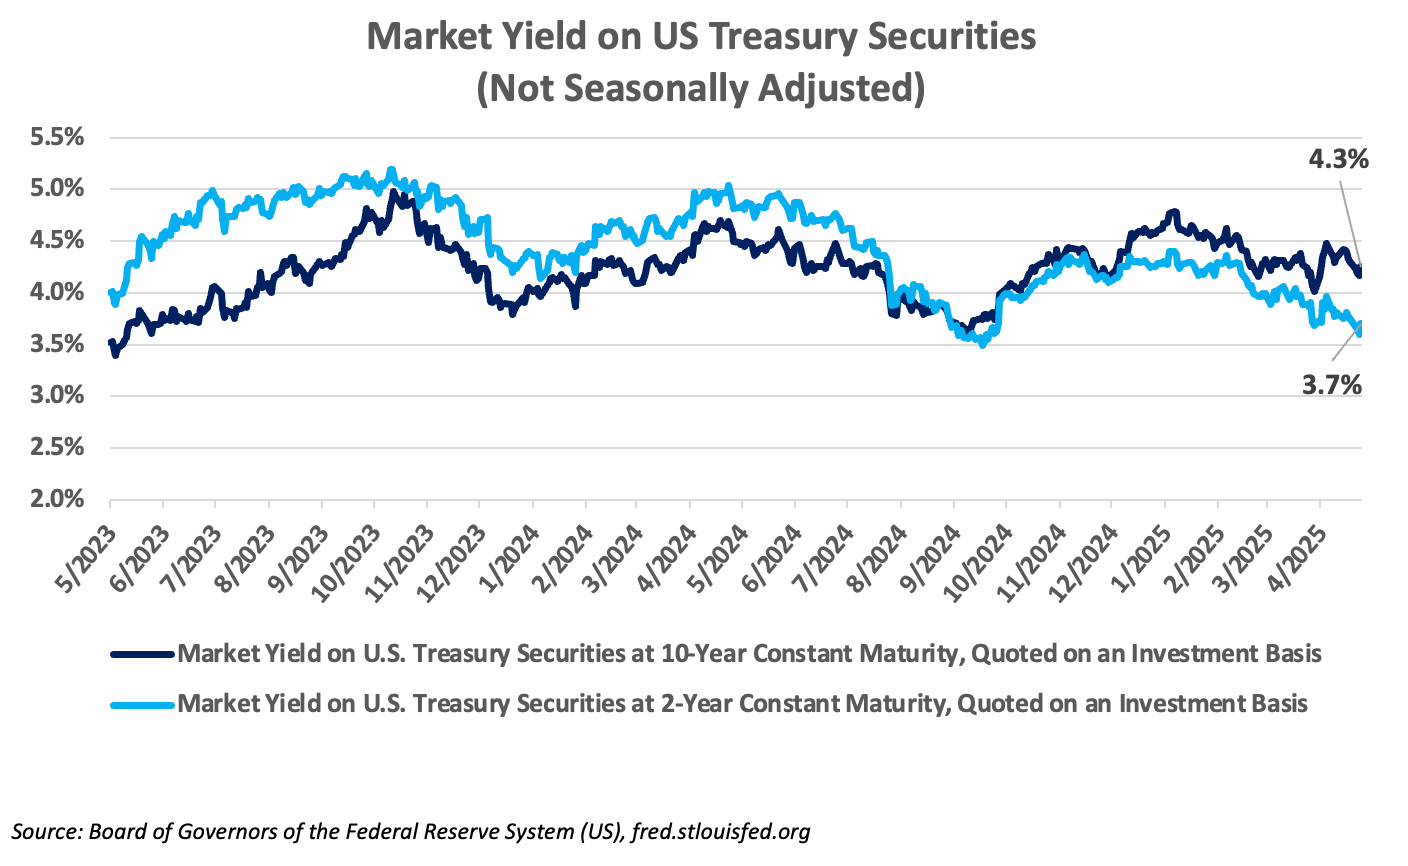
- Key 10-year Treasury rate at 4.31%
The Federal Reserve’s Open Market Committee will meet on May 6 and 7. They are widely expected to leave their target for short-term rates unchanged, as they did at their last meeting. Political pressure is mounting for a rate cut; however, most analysts have indicated that they believe the next cut will come at their June 17–18 meeting.
With the economy slowing down and inflation still above their target of 2%, the Fed is facing a very tough dilemma. Cut rates too soon, and inflation may stop improving or even turn up. Wait too long, and the economy may stall. Both risks are exacerbated by tariffs, which have the potential to add to inflation and dampen growth. The labor market continues to be strong, so unemployment is not forcing their hand at current levels. Most projections, and the bond market itself, are indicating that we will still get 1.00–1.25% of rate cuts by the end of 2025. While some short-term rates, notably the three-year Treasury, are lower, the 10-year Treasury remains above 4.3%. A great deal of longer-term credit rates, such as 30-year fixed mortgages, are priced off the 10-year Treasury. Under normal circumstances, the Federal Reserve has very little influence over intermediate-term rates, such as the 10-year Treasury. The ten-year yield spiked following the announcement of draconian tariffs on April 2 of this year. The pause that was subsequently announced on those tariffs has been attributed to the negative reaction of the bond market.
Markets
- Stocks recover with the postponement of tariffs
- International stocks gain ground
- Bonds earning yields above the inflation rate
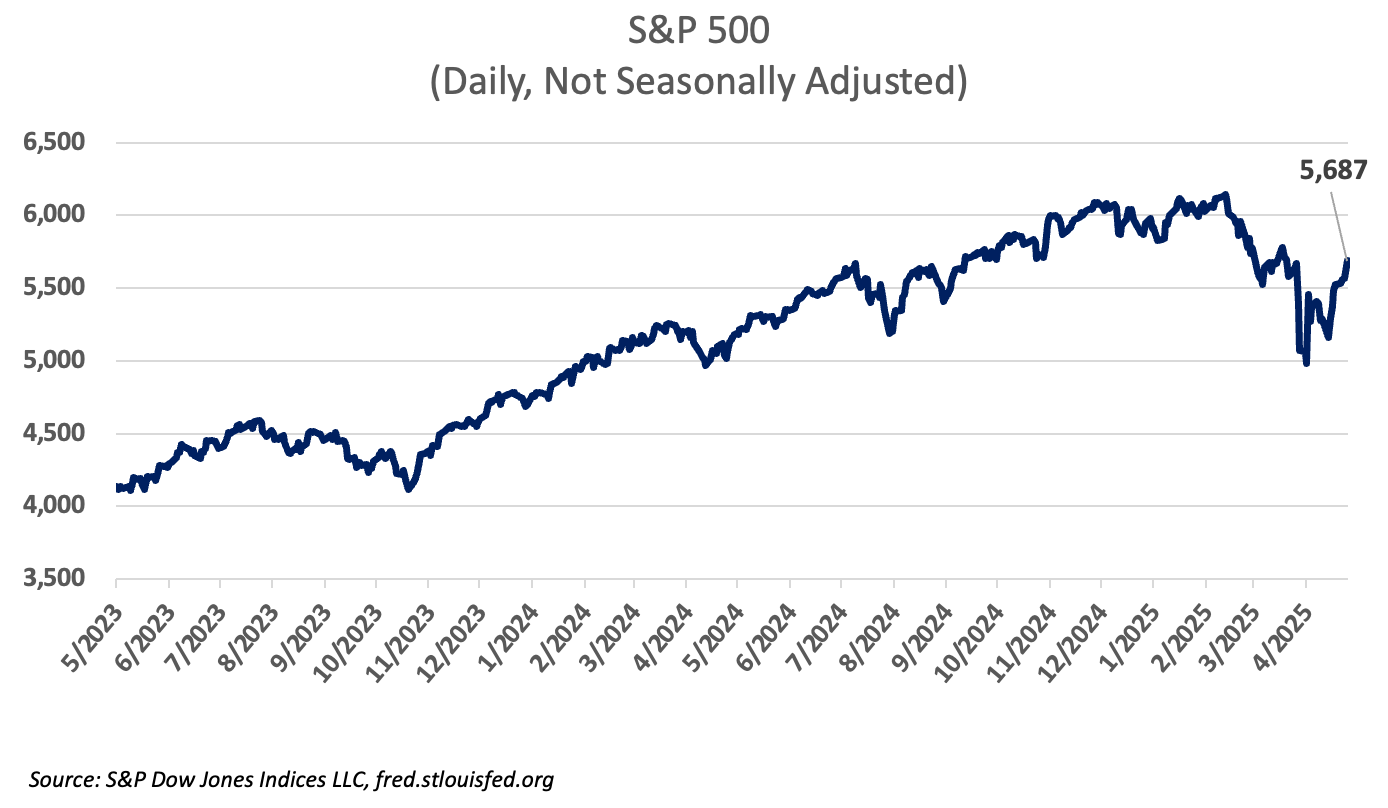
Markets sold off following the April 2 announcement of tariffs. On April 8, the S&P 500 closed at 4982.77, down 18.7% from this year’s closing high of 6129.53 on February 18. At this writing, that broad index has recovered the losses since April 2 but remains down 3.3% so far this year. International stock indexes, which have trailed their US equivalents for the last several years, have outperformed domestic stock indexes in this volatile environment.
The US dollar has lost ground against most major currencies; it’s down over 7% YTD compared to a basket of major foreign currencies.
The 10-year Treasury bond rose sharply in the days following the announcement of tariffs, even as stocks sold off. It’s unusual for bond yields to rise at the same time the dollar and stocks fall. Typically, investors would seek shelter in Treasuries during periods of extreme volatility, so having bond prices, stocks, and the dollar all fall together was an unusually negative reaction to the April 2 announcement. The administration’s subsequent decision to pause tariffs was probably made in response to the market reaction. The fact that stocks have recovered significant ground since then is evidence of their resilience in the face of changing economic policies.
If we can help you navigate this changing business climate, please do not hesitate to contact your United Community banker. We appreciate your readership.
Learn about our economy expert.

-
This information is for informational purposes only and does not constitute investment advice.
Sources:
GDP – Bureau of Economic Analysis
Employment & Inflation – Bureau of Labor Statistics
Interest Rates – Federal Reserve
P/E S&P 500 – multpl.com
Non-Deposit investment products and services, and Insurance products and services offered through United Community Banks, Inc. are:• NOT Insured by FDIC or Any Other Government Agency;
• NOT Guaranteed by United Community Bank or any affiliate of United Community Bank;
• NOT a Deposit or Obligation;
• Subject to Risk and May Lose Value
This content is not intended as, and shall not be understood or construed as, financial advice, investment advice, or any other advice. This content is provided for informational purposes only, without any express or implied warranty of any kind, including warranties of accuracy, completeness, or fitness for any particular purpose. United Community shall not be liable for any damages of any kind relating to such information not as to the legal, regulatory, financial or tax implications of the matters referred herein. All views and opinions expressed are those of the writer/commentator and do not reflect the views or positions of United Community.