


Economic Outlook
Navigating a Shifting Landscape
- The U.S. economy demonstrated resilience in 2025 despite numerous headwinds
- Labor market shows signs of stabilization after weakest hiring year since 2009
- Inflation remains stubbornly above the Fed’s 2% target
- Fed signals pause in rate cuts as policymakers assess conflicting data
- Stock market extends impressive run with third consecutive year of double-digit gains
Growth
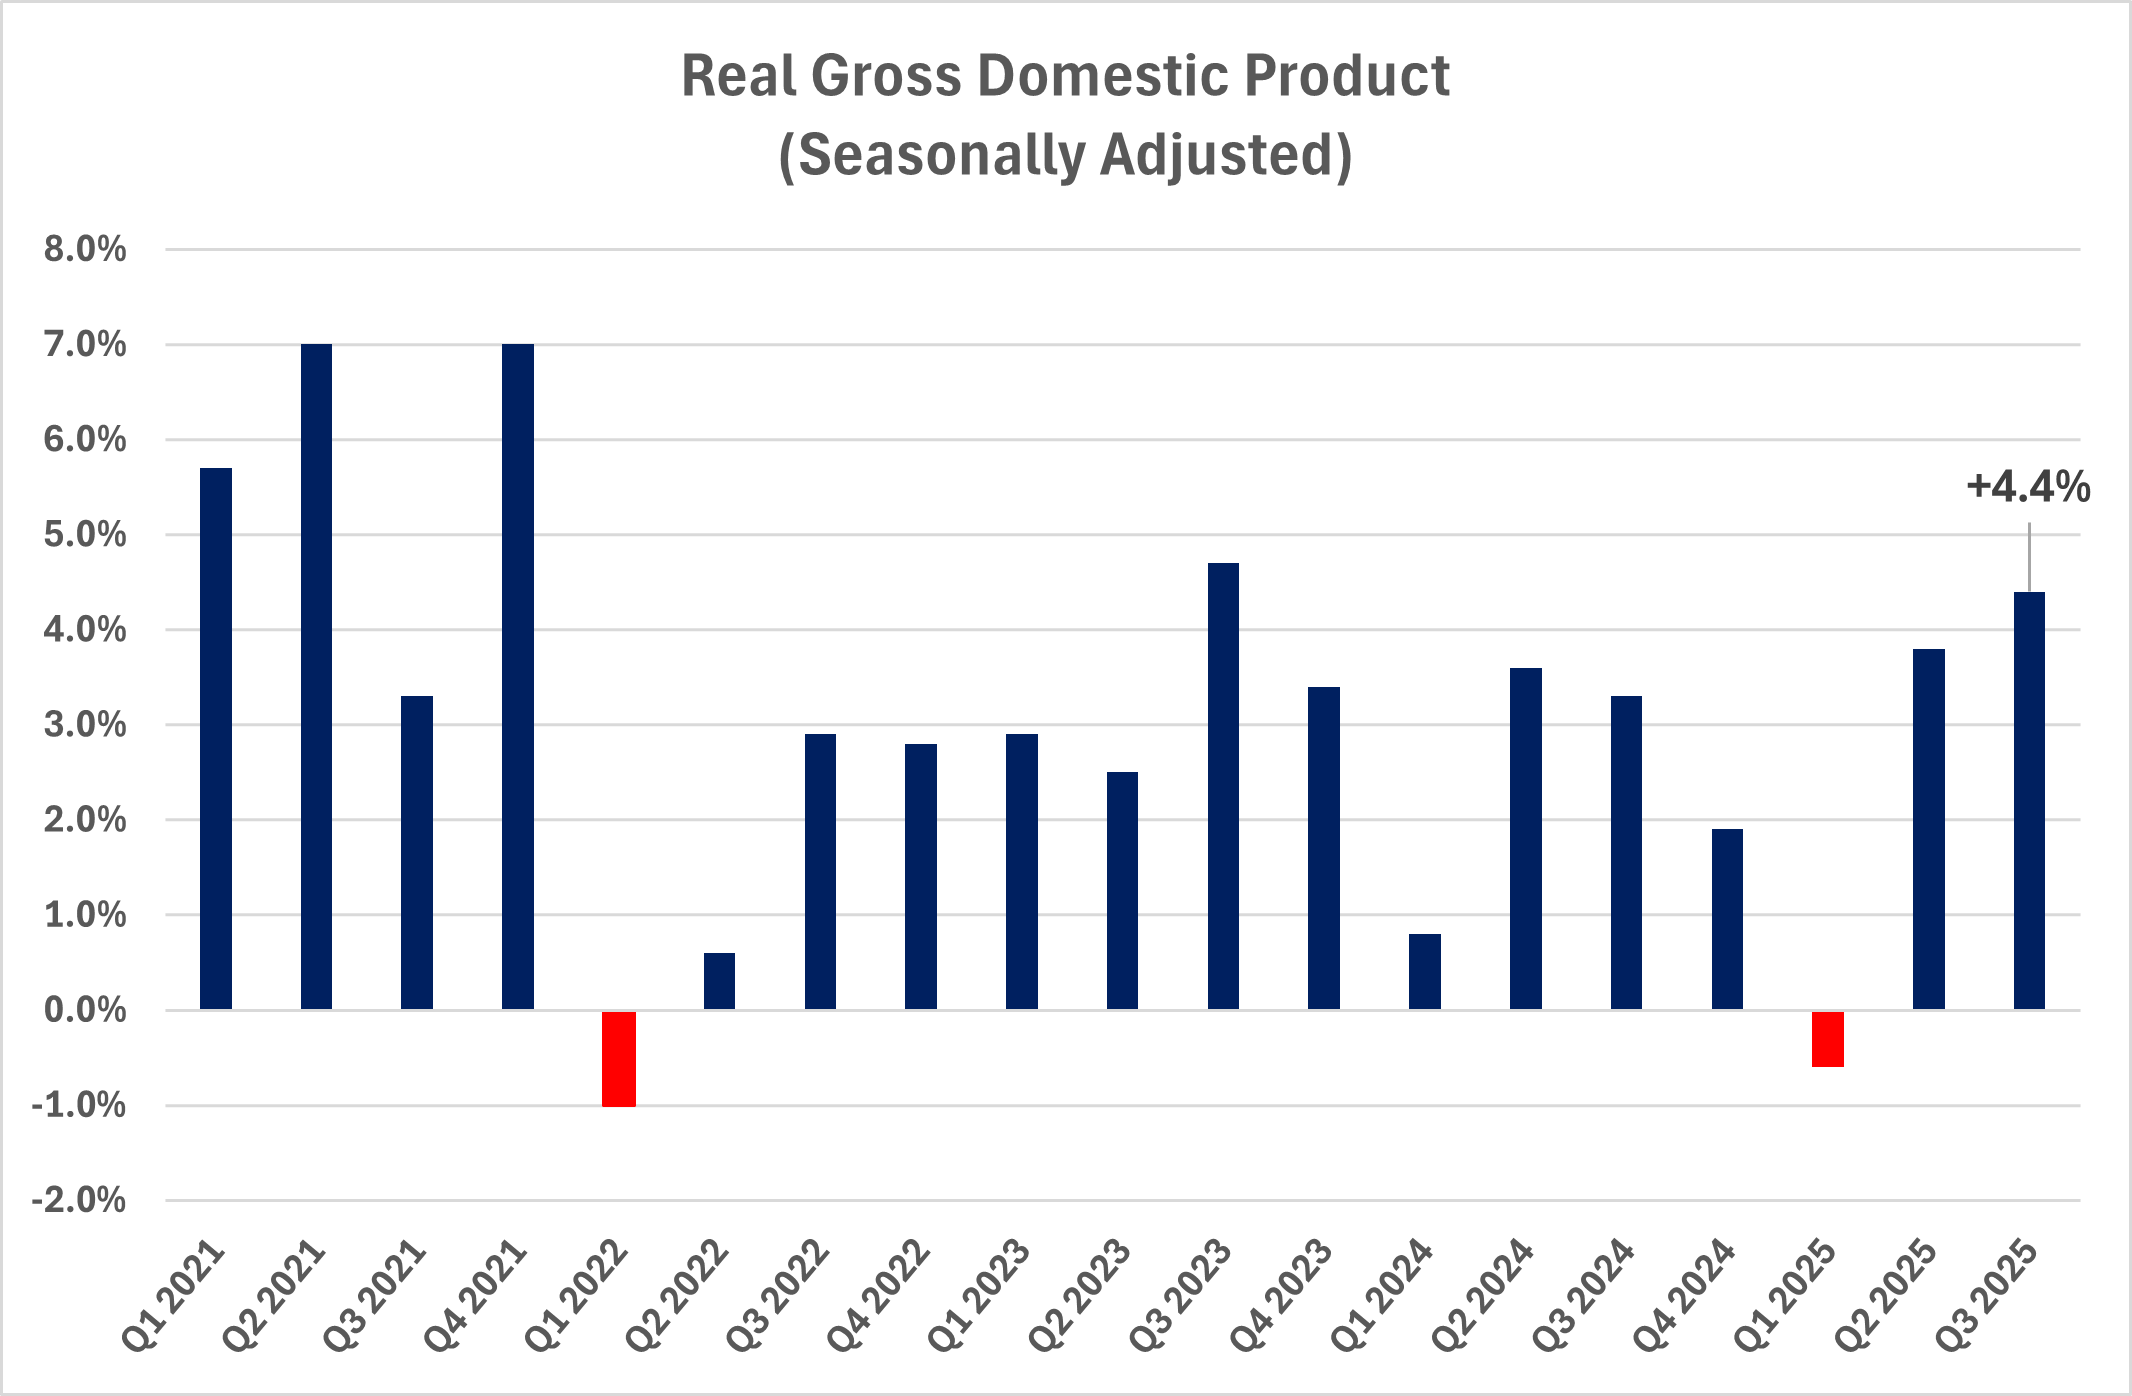
Real GDP surged 4.4% in the third quarter of 2025
Consumer spending remains the primary driver, rising 3.5% in Q3
Full-year 2025 growth estimated at 2.0%, with 2026 forecast at 1.9%
Housing market shows signs of life as mortgage rates ease
As 2026 begins, the US economy stands at a pivotal moment. After showing impressive resilience throughout 2025, growth is expected to cool as temporary tailwinds fade and deeper structural challenges emerge. The year ahead will hinge on how consumers, businesses, and policymakers navigate persistent inflation, a softening labor market, and heightened policy uncertainty.
The third quarter of 2025 delivered a strong 4.4% annualized growth rate—its best in two years and well above expectations—building on the second quarter’s solid 3.8%. Consumer spending, which accelerated to 3.5%, remained the primary driver. Yet this apparent strength masks a widening divide. Higher‑income households, supported by rising stock market wealth and still‑ample savings, continue to spend freely on travel, recreation, and big‑ticket items. Meanwhile, middle‑ and lower‑income households are becoming more cautious, curbing discretionary purchases amid persistent price pressures and eroding purchasing power. This K‑shaped pattern raises questions about the sustainability of recent consumption gains.
Retail data reflects this mixed environment. December sales rose 1.26% month‑over‑month and 3.54% year‑over‑year, pushing holiday spending to just over $1 trillion. Full‑year retail sales rose nearly 5%, but much of that growth mirrors higher prices rather than stronger volumes. Discretionary categories (clothing, sporting goods, general merchandise) saw modest improvements that depended heavily on promotions and favorable calendar timing rather than broad‑based demand.
Business investment shows a similar bifurcation. High‑tech spending surged 9.5% in the third quarter, driven by aggressive investment in AI infrastructure, data centers, and advanced computing. But outside this narrow group of large tech firms, traditional business investment fell 4%. Equipment spending was split between booming AI‑related expenditures and stagnant purchases of conventional machinery. Investment in structures declined for the seventh straight quarter, signaling continued caution amid high borrowing costs, softening demand, and regulatory uncertainty. This divergence echoes the K‑shaped pattern evident in consumer behavior.
Housing, long constrained by the Fed’s tightening cycle, is seeing early signs of stabilization. Existing home sales reached an annualized rate of 4.35 million units in December, the strongest since early 2023. Mortgage rates eased to around 6.16% in early January from nearly 7% a year prior. Prices rose modestly, reflecting a better supply‑demand balance. Yet affordability remains strained, with elevated prices and higher financing costs keeping many would‑be buyers sidelined. Limited inventory persists, as homeowners with low mortgage rates remain reluctant to sell.
Looking ahead, growth is expected to moderate from roughly 2.0% in 2025 to around 1.9% in 2026, aligning more closely with long‑term potential. Several forces will contribute: fading temporary boosts from trade adjustments, slower wage and income growth as the labor market softens, reduced net immigration, and normalization in consumer spending as wealth effects diminish. Elevated interest rates will continue to weigh on business investment and housing even as the Fed gradually eases policy.
Still, the economy enters the year with notable supports. Real disposable income growth, while modest, is positive after adjusting for inflation. Corporate balance sheets remain strong, with healthy margins providing a buffer against softer demand. Ongoing investment in AI and digital technologies is fostering productivity improvements that could offset slower labor-force growth. Fiscal policy will also provide meaningful support in 2026, with the One Big Beautiful Bill Act delivering roughly $1.2 trillion in tax cuts and infrastructure spending over two years. Expanded child tax credits, accelerated depreciation for business equipment, and funding for semiconductor and clean‑energy projects will provide an economic tailwind, but they also add to an already large deficit and complicate the Fed’s inflation‑fighting efforts.
Risks, however, remain significant. Trade policy uncertainty persists, clouding business planning. The K‑shaped recovery leaves the economy vulnerable to further labor‑market weakening, which would disproportionately affect the households most sensitive to inflation. Geopolitical tensions and global supply‑chain pressures also pose downside risks, particularly through their impacts on energy prices and corporate sentiment.
Overall, the US economy is expected to continue expanding in 2026, though at a more subdued pace than in recent years. Whether this moderation becomes a sustainable soft landing or a precursor to deeper slowdown will depend on how these competing forces evolve in the months ahead.
Employment
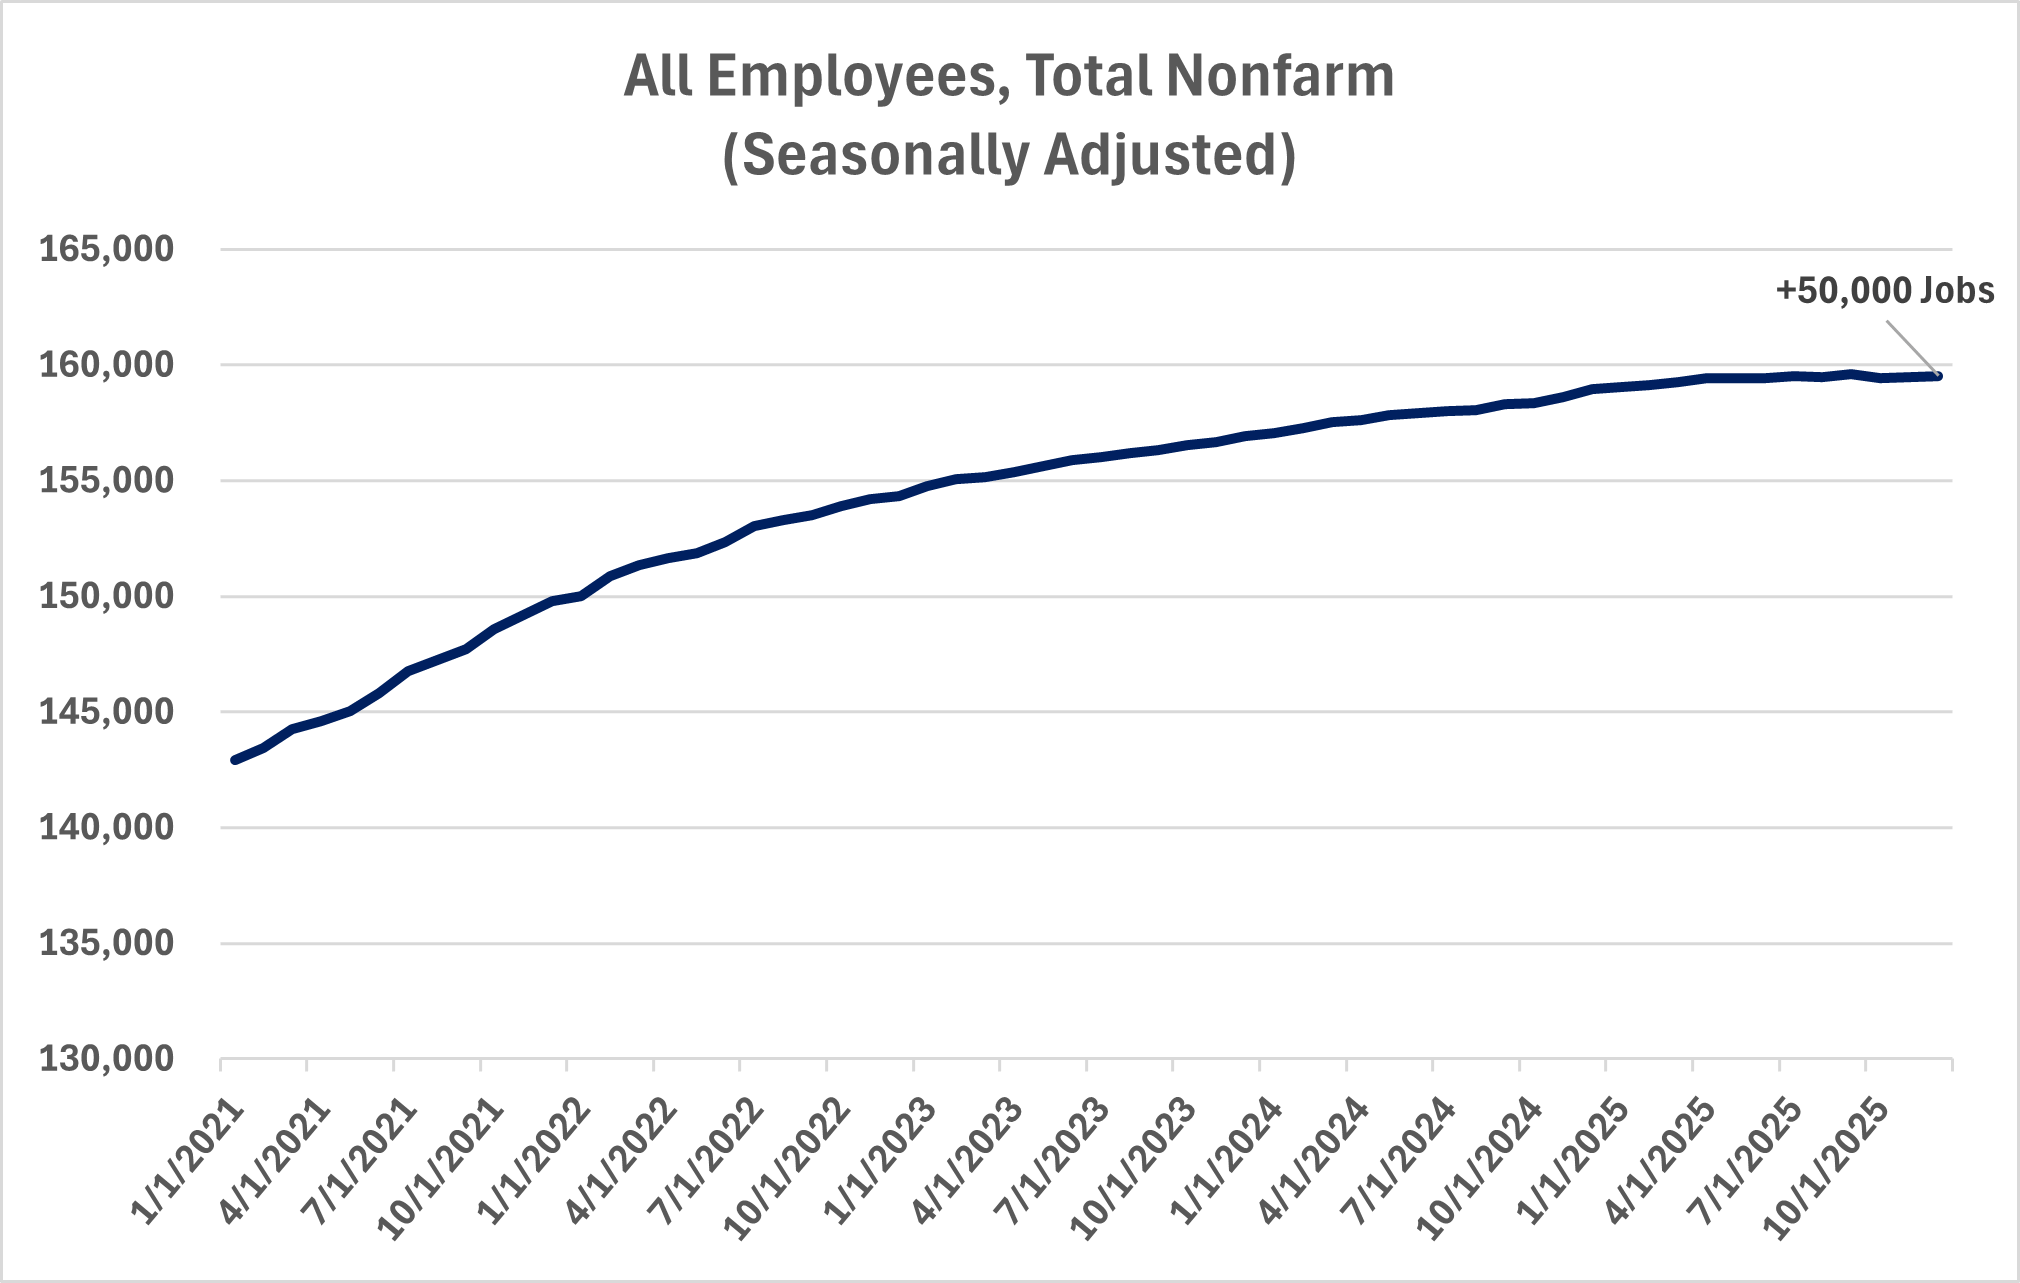
- Payrolls added only 50,000 jobs in December 2025
- Full-year job growth of 584,000 marks weakest performance since 2009 outside recessions
- Unemployment rate stands at 4.4%, up from 4.0% at the start of 2025
- Labor productivity surged 4.9% in Q3 2025, the fastest pace in two years
- “Hiring recession” characterizes labor market despite limited layoffs
The US labor market ended 2025 on a notably weak footing, with December adding only 50,000 jobs—well below expectations and consistent with the sluggish hiring that defined much of the year. Payrolls grew by just 584,000 positions in 2025, an average of 49,000 per month and the slowest non‑recession annual pace since 2009. This stands in sharp contrast to the 2 million jobs added in 2024. The abrupt slowdown has become one of the most consequential economic developments of the year and played a decisive role in the Federal Reserve’s move toward monetary easing.
What makes this downturn unusual is its composition. Rather than layoffs, the weakness has emerged through a collapse in hiring—a “hiring recession” in which businesses retain existing employees but sharply curtail new additions. Job turnover and separations remain low, yet firms have grown more cautious amid demand uncertainty, regulatory shifts, and broader concerns about the economic outlook.
Monthly data highlights this shift. Roughly 85% of 2025’s job gains occurred in the first four months of the year, after which hiring fell dramatically. October was especially weak, with revised data showing a loss of 173,000 jobs. November added just 56,000, and December’s 50,000 gain continued the pattern. With about 75,000 monthly jobs needed to keep pace with population growth, the labor market is barely maintaining equilibrium. This breakeven threshold is down sharply from early 2024 due to lower immigration and slowing population growth, yet even with this reduced bar, job gains have been insufficient to strengthen conditions.
The unemployment rate offered a modestly better signal, falling to 4.4% in December from 4.6%. Still, part of the improvement stemmed from a dip in labor force participation to 62.4%, indicating some discouraged workers have stopped searching for jobs. Unemployment remains above the 4.0% level at the start of 2025 and well above the lows reached in 2022–2023. The broader U‑6 measure of labor underutilization fell to 8.4%, and the household survey showed employment rising by 232,000 in December, suggesting conditions are deteriorating more slowly than payroll numbers alone imply—though measurement noise remains significant.
Sector-level data underscores the unevenness. Healthcare was again the standout, adding 21,000 jobs in December and 713,000 for the year. Social assistance and food services also posted steady gains. These less cyclical sectors have provided crucial support. Meanwhile, manufacturing shed 68,000 jobs in 2025, professional and business services lost 97,000, and retail trade dropped 25,000 jobs in December alone, reflecting weak goods demand and seasonal dynamics.
Wage growth moderated but remains above pre‑pandemic norms. Average hourly earnings rose 3.8% year‑over‑year in December, down from the peaks of the labor‑shortage period but still outpacing productivity gains. The average workweek ticked down to 34.2 hours, another sign of softer labor demand.
Several structural forces are contributing to the slowdown. Tighter immigration policies have restricted labor supply, especially in service sectors. Elevated interest rates and persistent policy uncertainty around trade, taxes, and regulation have made firms cautious about expanding payrolls. Meanwhile, productivity gains from AI and automation are enabling companies to meet demand with fewer new hires, a trend likely to intensify.
Looking to 2026, the labor market faces continued headwinds. Unemployment is expected to drift toward 4.5% by midyear as more workers re-enter the labor force and hiring remains subdued. Monthly job growth is likely to stay in the 50,000–100,000 range—enough to maintain stability but insufficient to materially lower unemployment or drive strong wage growth. A more pronounced downturn remains possible if economic conditions soften further and firms move from hiring freezes to actual layoffs.
Even so, several factors should limit the risk of a severe contraction. Firms remain wary of shedding workers after struggling to hire during the post-pandemic recovery, and persistent labor shortages in healthcare, skilled trades, and technology provide a buffer. The Fed’s shift toward easier policy should also lend support to demand and, in turn, labor market conditions.
Labor market weakness was the key factor driving the Fed’s rate cuts in late 2025, marking a clear inflection point after years of tight conditions. How employment evolves in 2026 will play a central role in shaping both monetary policy and the broader economic trajectory.
Inflation
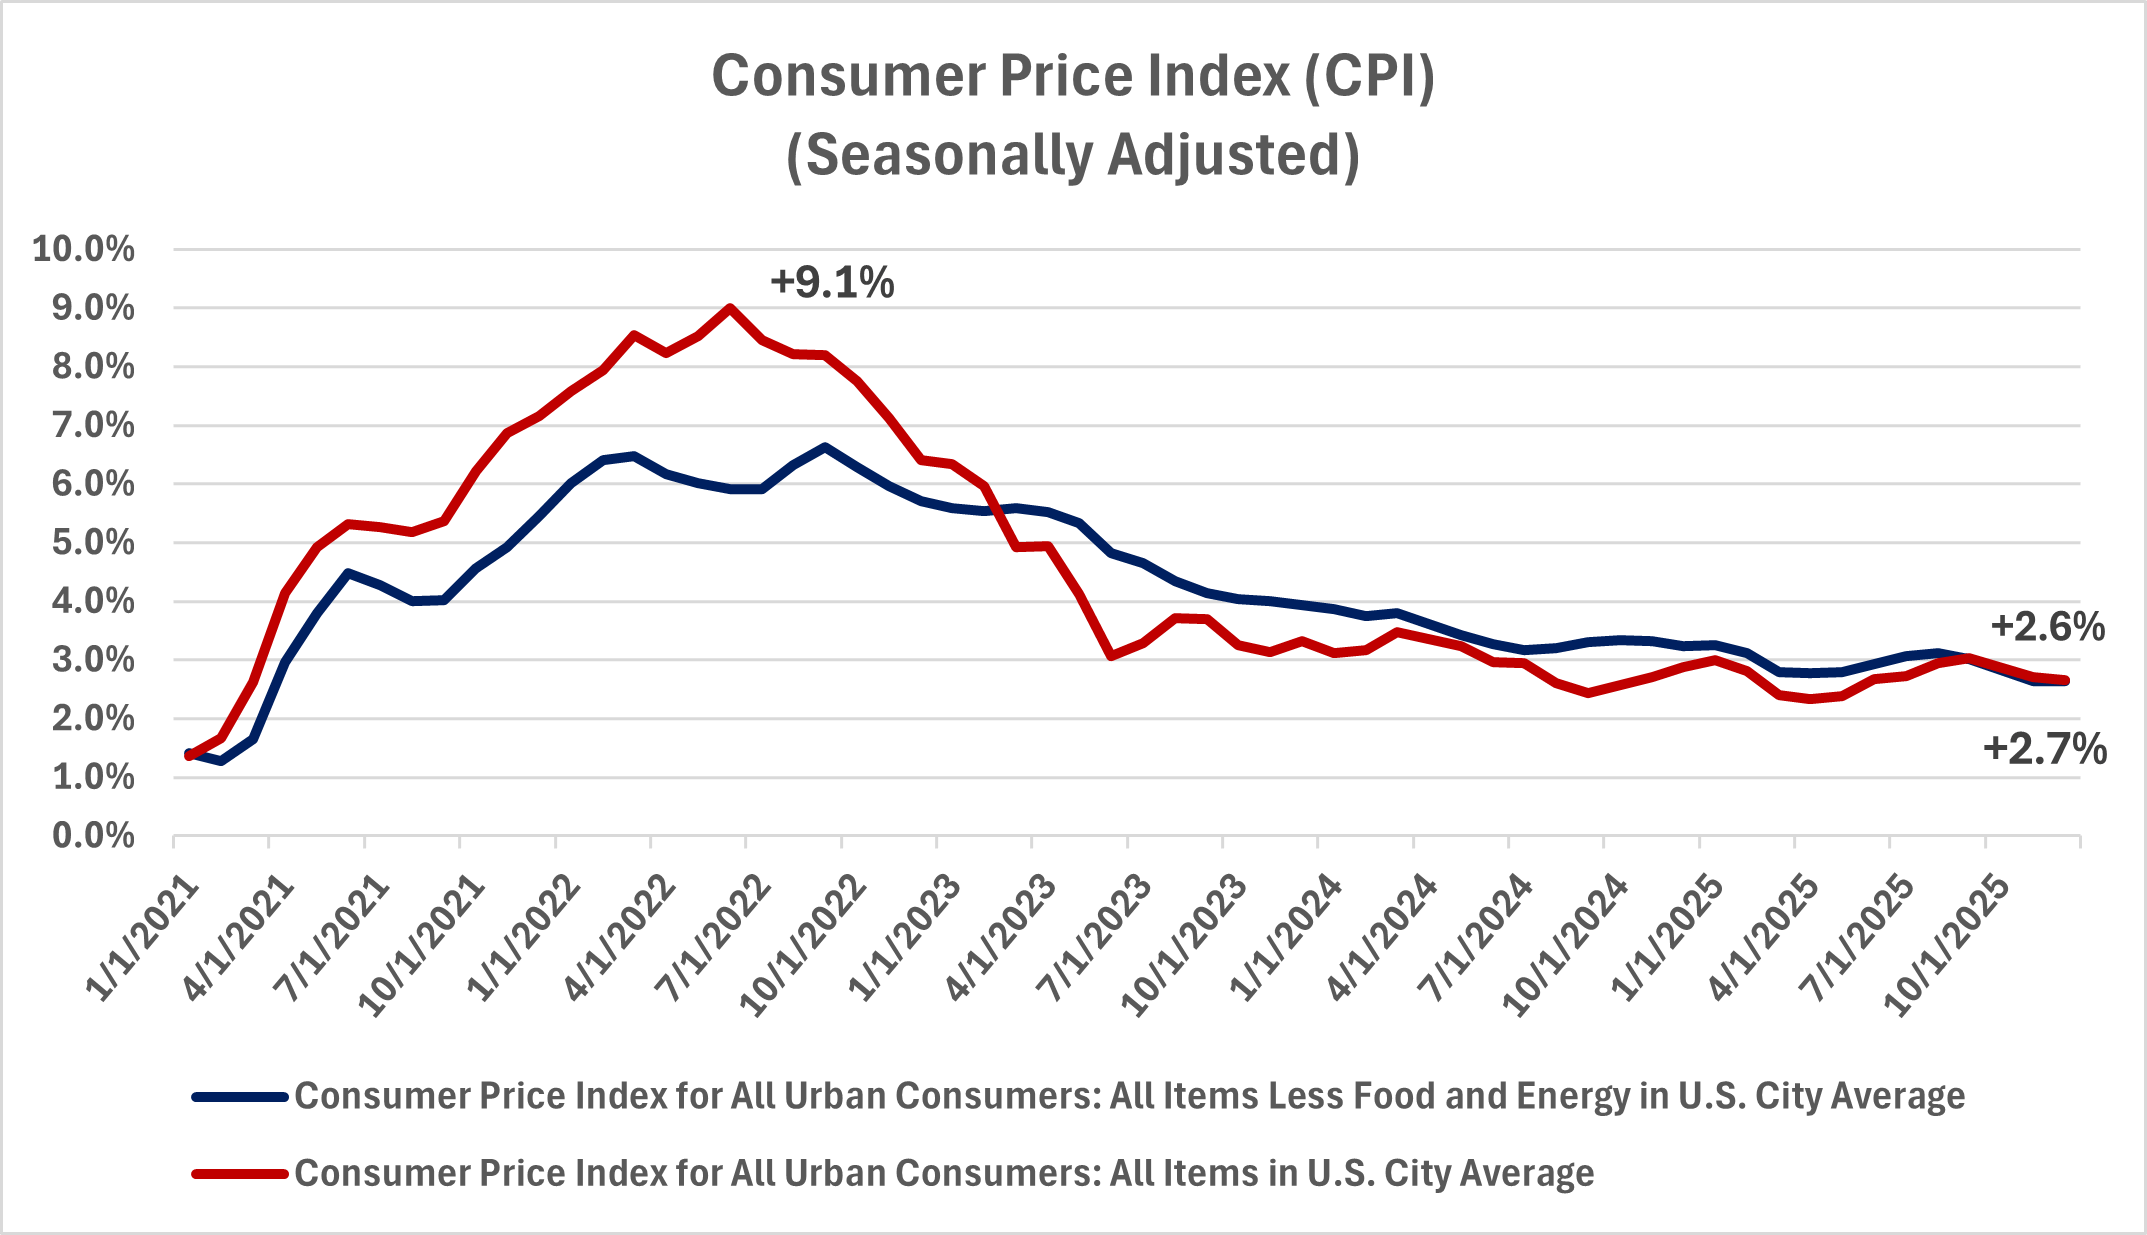
- Consumer prices rose 2.7% year-over-year in December 2025
- Core inflation remains sticky at 2.6%, well above the Fed’s 2% target
- Food and shelter costs continue to pressure household budgets
- Tariff impacts appear muted but ongoing
For much of 2025, inflation proved to be the economy’s most stubborn challenge, refusing to make significant progress toward the Federal Reserve’s 2% target despite more than two years of restrictive monetary policy. December’s Consumer Price Index reading of 2.7% year-over-year, unchanged from November, capped a year of uneven progress and underscored the difficulty of fully extinguishing inflationary pressures once they become embedded in the economy. While both headline and core inflation rates showed modest improvement from their January levels of 2.9% and 3.3%, respectively, to 2.7% and 2.6% by year-end, this deceleration was far slower than policymakers had hoped, marking the 55th consecutive month that inflation remained above the Fed’s target. The Fed’s preferred inflation gauge, the core Personal Consumption Expenditures (PCE) price index, stood at 3.0% in December, the most recent data available, further reflecting the persistent nature of price pressures across multiple measures.
Monthly inflation readings provided further evidence of inflation's stickiness. The CPI rose 0.3% in December, up from 0.1% in November, though the November reading was artificially depressed by data collection disruptions caused by the lengthy government shutdown. Core inflation, which excludes volatile food and energy prices, increased 0.2% month-over-month in December, slightly cooler than the 0.3% increase economists had anticipated. While this deceleration was welcome, the monthly pace remained above the roughly 0.2% rate consistent with the Fed's 2% annual target.
Several categories continued to drive elevated inflation. Shelter costs, which carry significant weight in the CPI basket, rose 3.2% year-over-year and increased 0.4% month-over-month in December. Housing-related inflation has been particularly persistent, reflecting tight rental markets, elevated home prices, and the lagged way in which shelter costs are captured in official statistics. The shelter component alone accounts for a substantial portion of the gap between current inflation and the Fed's target.
Food price inflation accelerated to 3.1% year-over-year in December, up from 2.6% in November and marking the highest rate since August. Monthly food prices jumped 0.7%, reflecting increases across both grocery store purchases and restaurant dining. Ground beef prices surged 15.5% year-over-year, while coffee climbed 19.8%—increases that have been acutely felt by consumers. The acceleration in food inflation represents a meaningful reversal after months of moderation and poses a particular challenge for lower-income households that spend a disproportionate share of their budgets on necessities.
Energy prices provided some relief, rising just 2.3% year-over-year in December compared to 4.2% in prior months. Gasoline prices actually fell 3.4% from a year earlier, helping to offset some of the pressure from other categories. However, utility costs remained elevated, with piped gas service up 10.8% year-over-year and electricity climbing 6.7%. The surge in electricity prices has been partly attributed to soaring demand from data centers supporting AI applications and cloud computing, a structural factor unlikely to reverse quickly.
Beyond the major categories, inflation remained widespread. Medical care costs rose 3.2% year-over-year, household furnishings and operations increased 4.0%, recreation climbed 3.0%, and personal care services advanced 3.7%. Even traditionally disinflationary categories showed price pressures, with used cars and trucks posting a 1.6% annual gain and apparel increasing 0.6%. The breadth of these price increases suggests that inflation has become embedded across many sectors rather than being driven by a narrow set of factors, complicating the Fed’s efforts to achieve its 2% target.
Tariffs imposed earlier in 2025 have contributed to inflation, though the impact appears to have been more muted than many economists initially feared. One estimate suggests tariffs are adding approximately 0.3 percentage points to the inflation rate. Many retailers and importers absorbed a portion of the tariff costs rather than fully passing them through to consumers, protecting their market share in a competitive environment. However, the full effects may not yet be evident in the data. Profit margins were strong at the beginning of the year, allowing businesses to absorb higher import costs, but this buffer is gradually eroding. As the year progresses, more of these costs may show up in consumer prices, particularly if businesses regain pricing power or if additional tariff measures are implemented.
The persistence of inflation above target has important implications. It constrains the Federal Reserve’s ability to provide monetary accommodation even as the labor market weakens, forcing policymakers to carefully balance dual mandate risks. Elevated inflation continues to erode real purchasing power, particularly for middle- and lower-income households that have largely exhausted pandemic-era savings, keeping consumer sentiment depressed despite the slower pace of price increases from 2022’s peak. Perhaps the most concerning, persistently high inflation risks become more entrenched in expectations, making it more difficult to return to the 2% target without a more significant economic slowdown.
Looking ahead to 2026, the inflation outlook is mixed. On the one hand, several factors should support continued disinflation. Housing inflation is expected to moderate as tight rental markets ease and the lagged effects of slower home price growth work through the data. Wage growth is decelerating as the labor market cools, reducing cost pressures from compensation. Energy prices are likely to remain relatively stable, and goods inflation should stay subdued as global supply chains continue to normalize and the dollar's weakness makes imports more expensive but also boosts exports.
On the other hand, meaningful risks to the inflation outlook remain. Services inflation, which reflects labor costs, may prove difficult to reduce without a more substantial weakening in labor markets. The expansionary fiscal policy from the One Big Beautiful Bill Act could add demand pressure when the economy is already operating near capacity. Tariff uncertainty and geopolitical energy risks could produce unexpected price shocks, while dollar weakness over the past year may continue placing upward pressure on import prices.
Most forecasters expect inflation to remain in the 2.5% to 2.7% range for much of 2026, gradually declining toward but not quite reaching the Fed's 2% target. This trajectory would represent continued progress but also suggest that the final mile of the disinflation process will be the most challenging. Patience will be required from both policymakers and the public as the economy navigates this extended period of above-target but moderating inflation.
Interest Rates
- The Fed cut rates to 3.50%–3.75% range in December 2025
- Fed signals pause in rate cuts as officials assess economic data
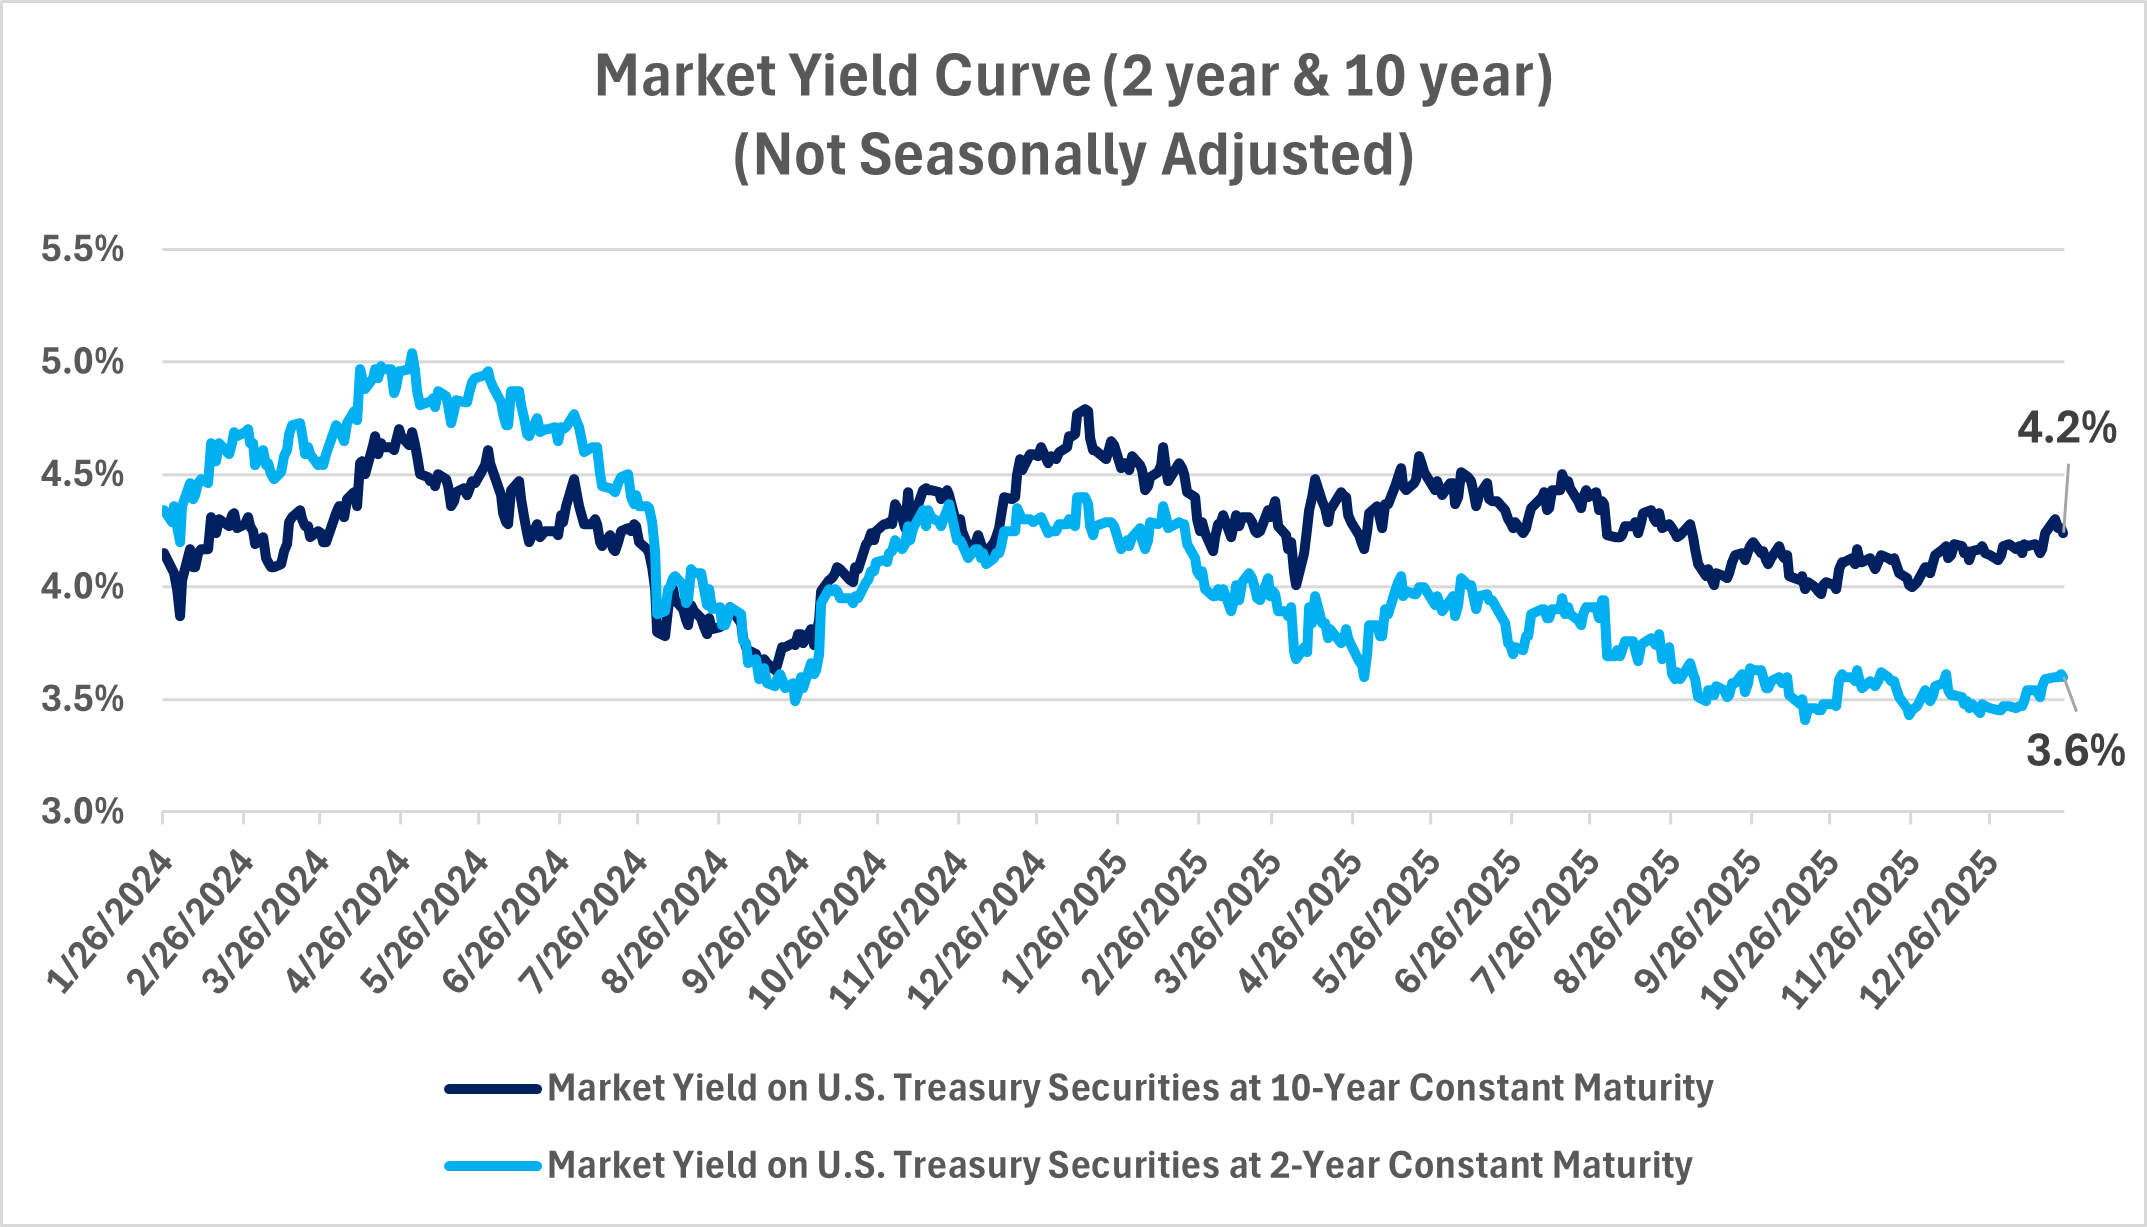
- Key 10-year Treasury yield stands at around 4.2%
- Longer-term rates remain elevated despite Fed easing
The Federal Reserve’s approach to monetary policy shifted meaningfully in late 2025, moving from a long period of restrictive policy aimed at containing inflation to a more accommodative stance intended to support the weakening labor market. This transition has proven more complex than expected, as policymakers confront persistent inflation alongside a steadily deteriorating employment backdrop.
On December 10, 2025, the Federal Open Market Committee cut its target rate by 25 basis points to a range of 3.50%–3.75%, marking its third consecutive reduction and bringing the effective funds rate to roughly 3.64%. The decision was unusually contentious: three members dissented—two favoring no change due to inflation concerns, and newly appointed Governor Stephen Miran pushing for a deeper 50‑basis‑point cut. This was the highest level of dissent since 2019 and underscored the Committee’s genuine uncertainty about the appropriate policy path.
Chair Jerome Powell framed the move as a “risk management” step, signaling that the Fed’s concerns had shifted decisively toward labor market weakness. Earlier in the year, persistently high inflation and solid growth kept interest rates at their highest levels in more than two decades. But a sharp deterioration in job data, including sizable downward revisions to prior employment reports, forced the Fed to act even with inflation still above target.
Updated economic projections highlighted the policy divide. The median “dot plot” showed only one additional rate cut in 2026, bringing the target range to 3.25%–3.50% by year‑end, though individual forecasts varied widely. Policymakers also revised their outlook more optimistically, boosting 2026 GDP growth expectations to 2.3% and lowering core PCE inflation projections to 2.4%, while holding the unemployment forecast at 4.4%. These forecasts point to a continued expansion with gradually falling inflation, though many economists view them as optimistic given the mixed signals in recent data.
Financial markets anticipate a slightly more accommodative path, pricing in two cuts in 2026—about 50 basis points in total—and largely expecting no change at the March meeting, with the next potential move coming mid‑year.
However, the Fed’s influence is concentrated in short‑term rates, and longer-term yields have not followed suit. As of mid‑January 2026, the 10‑year Treasury yield remains near 4.2%, while the 30‑year hovers around 4.9%. These elevated yields reflect persistent inflation concerns, uncertainty about the Fed’s long‑run stance, and heavy federal borrowing—annual deficits near $1.8 trillion continue to drive substantial Treasury issuance and keep term premiums elevated.
High long-term yields have important economic implications. Most borrowing costs—from mortgages to corporate loans—are tied to longer-term Treasury rates, not the fed funds rate. Mortgage rates remain above 6%, down from last year but still far from the pandemic lows. Similar dynamics apply to credit cards, auto loans, and business financing, limiting the stimulus typically associated with rate cuts. The modestly positive spread between 2‑year and 10‑year yields signals expectations for slight further easing but muted long‑term growth prospects.
The Fed has limited options to pull long-term rates down. Outside of crises or wartime, it rarely intervenes directly with programs like quantitative easing, and doing so now could send the wrong signal about economic stability. Its balance sheet also remains elevated from past interventions, reducing its maneuverability.
Fiscal pressures further complicate the picture. With deficits at $1.78 trillion and debt approaching 100% of GDP, Treasury issuance remains heavy. Interest costs now exceed $1.2 trillion annually, surpassing defense spending, and this growing supply of debt continues to push yields higher, especially at longer maturities.
Another layer of uncertainty surrounds leadership. Chair Powell’s term expires in May 2026, and President Trump has openly advocated for lower rates to support growth. This dynamic could place political pressure on the Fed at a time when inflation remains above target, potentially influencing both policy decisions and market confidence in the Fed’s independence.
For households and businesses, the implications are clear: although short-term rates have eased, longer-term borrowing costs are likely to stay elevated. This “higher-for-longer” environment will continue to weigh on housing, durable goods, and business investment unless political pressure pushes the Fed into faster cuts than the economic data justifies—risking a rebound in inflation. At the same time, savers benefit from the most attractive real returns on safe assets in more than a decade.
Markets
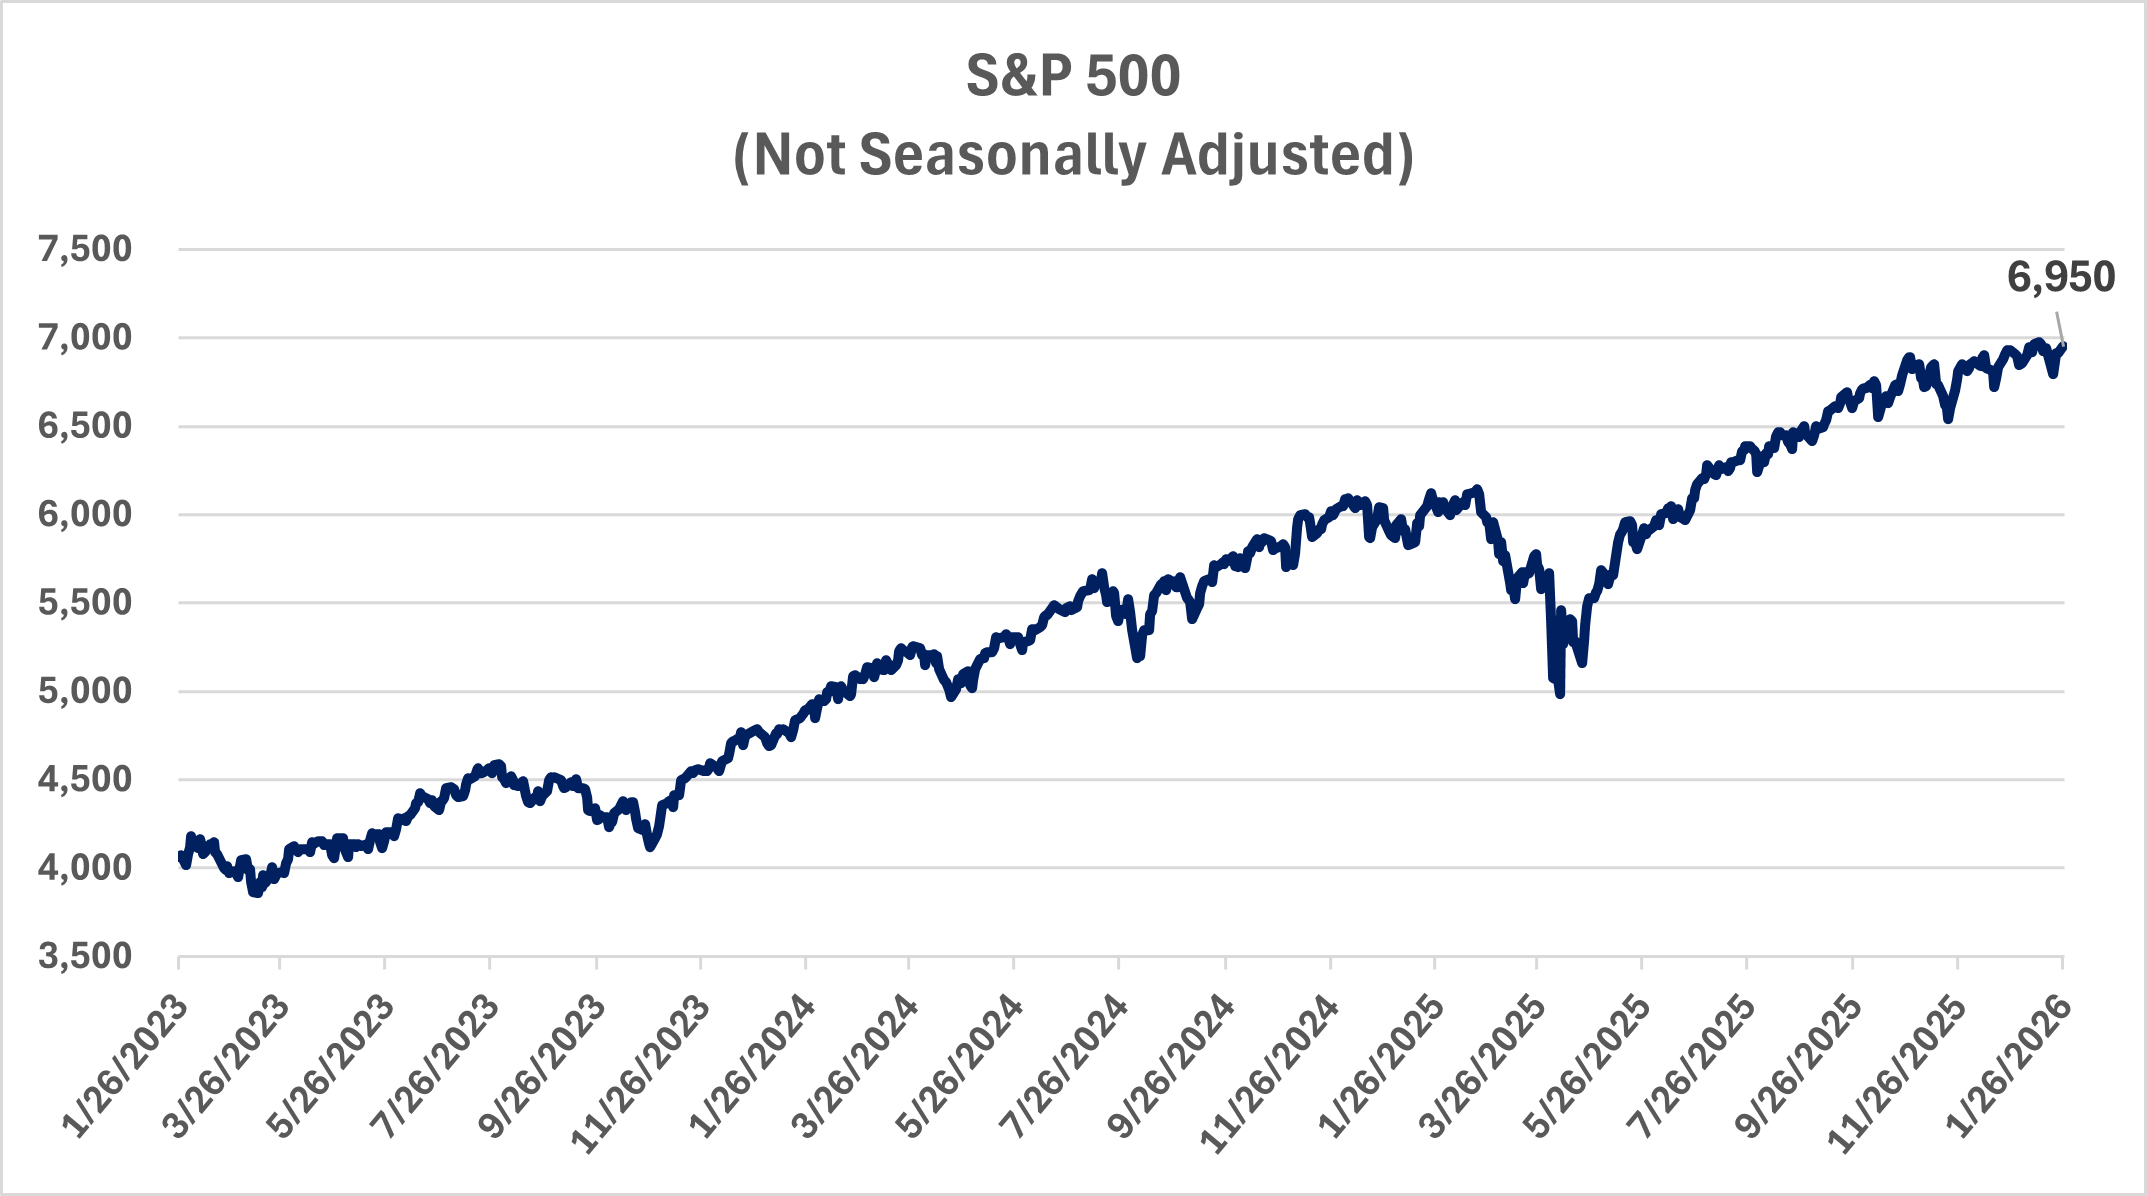
- S&P 500 delivered 17.9% total return in 2025, the third straight year of double-digit gains
- Valuations stretched with forward P/E ratio of 22x, matching 2021 peak
- Narrow market leadership continues, driven by Mag 7 and AI enthusiasm
- Bond yields remain attractive for investors seeking capital preservation
US equity markets closed 2025 with another strong year, extending a run in which the S&P 500 has delivered three straight years of double‑digit gains—something not seen since the late‑1990s tech boom. The index rose 16.39% on a price basis, or 17.88% with dividends, lifting its three‑year total return to 88%. The Dow added 12.97%, and the Nasdaq advanced roughly 20%, reinforcing how strong the rally ultimately became.
These gains came despite periods of significant stress. In April, the S&P 500 briefly approached bear‑market territory after President Trump’s sweeping tariff announcement sent the VIX spiking to 60.13. A prolonged government shutdown muddied economic data and raised concerns about policy dysfunction, while heightened geopolitical tensions and intermittent fears of an AI‑driven valuation bubble triggered sharp but short‑lived pullbacks. Each setback, however, met renewed demand, highlighting the underlying strength of the market narrative.
Corporate earnings were a major pillar of support. Companies continued to meet or exceed expectations throughout the year, with third‑quarter earnings projected to grow 7.7% year‑over‑year, marking nine consecutive quarters of positive growth. Full‑year earnings rose roughly 12.4%, and analysts see nearly 15% growth ahead in 2026. Although some investors questioned whether such momentum could be sustained, these results helped justify the market’s elevated multiples.
The AI theme remained central to market psychology. Technology stocks gained nearly 24%, led by mega‑cap names such as NVIDIA, Microsoft, Apple, and other members of the “Magnificent 7.” Their influence on the broader index has become striking: the group now represents about 35% of the S&P 500’s weight, compared to just 11% a decade ago. NVIDIA and Microsoft alone account for 14% of the index and are projected to drive nearly a third of the S&P’s expected 2026 returns. This concentration offers powerful tailwinds during risk‑on periods but introduces fragility should sentiment toward AI shift.
Market breadth improved meaningfully in the final months of 2025, with healthcare, industrials, and financials delivering solid gains and, in some cases, outpacing technology. Communication services led all sectors for the full year with a 32.41% advance, while real estate posted a modest decline. The broadening has continued into early 2026: small‑caps have strongly outperformed, with the Russell 2000 up nearly 7% and micro‑caps over 9% year‑to‑date. More attractive relative valuations and expectations of continued Fed rate cuts have disproportionately benefited smaller, more rate‑sensitive companies. International markets also performed well in 2025, with the MSCI World Index up 17%, supported by cheaper valuations abroad and a 9% decline in the US dollar—its weakest performance since 2017.
The dollar’s weakness, while boosting foreign‑equity returns through currency translation, underscores concerns about US fiscal and policy stability. Large federal deficits, tariff uncertainty, political tensions surrounding the Federal Reserve, and slower‑than‑expected domestic growth have all contributed to downward pressure. With interest‑rate differentials narrowing, the continued decline appears increasingly structural, making international diversification more appealing as both a return and risk management tool.
Fixed income markets offered their most compelling risk‑adjusted opportunities in years. With positive real yields and more attractive nominal rates, investors could earn meaningful returns without equity‑level volatility. High-quality five‑year corporate bonds yielded over 4.6%, and the Bloomberg US Aggregate Bond Index returned 3.9%. Yet structural pressures remain. Heavy Treasury issuance tied to the One Big Beautiful Bill Act’s $1.2 trillion in deficit spending, as well as Japan’s escalating debt crisis—where 30‑year Japanese government bond yields reached a record 3.89%—pose risks of renewed upward pressure on global yields. If Japan is forced to sell US Treasuries, the ripple effects could be significant.
Gold was a standout performer, rising above $4,000 per ounce and gaining more than 60% from 2024. Its surge, despite rising real rates, highlighted growing investor sensitivity to inflation risks, currency debasement concerns, and geopolitical instability.
Looking ahead to 2026, markets face a more complicated backdrop. After three years of strong returns, mean reversion alone points to more modest gains. Earnings expectations of roughly 15% may be difficult to achieve given a cooling labor market, slower economic growth, tariff‑related pressures, and the drag from a weaker dollar. With valuations stretched and market leadership highly concentrated in a handful of mega‑cap tech companies, the path forward depends heavily on the continued durability of AI enthusiasm and companies’ ability to deliver on ambitious profit expectations.
Jonathan Handshoe Investment Analyst
Jonnathan Handshoe is an investment analyst at United Community, where he leads due diligence and ongoing oversight of ETFs, mutual funds, and SMA managers. He regularly presents to the Asset Management Council and drives research initiatives that support portfolio construction and manager selection across the organization. Before joining United, Jonnathan was an equity research analyst at CFRA Research, covering more than 40 public companies across the oil & gas and passenger airlines sectors. He developed thesis-driven views supported by detailed financial modeling and published frequent research notes and thematic research reports. Previously, he served as a mortgage underwriter at CIVIC Financial Services, focusing on real estate investment loans. His earlier experience includes credit and operations roles at Lima One Capital and ScanSource, where he analyzed borrower portfolios and supported senior leadership in credit decisions. Prior to joining the financial and investment services industry, Jonnathan began his career in the United States Marine Corps, serving for a decade and deploying to Helmand Province, Afghanistan, where he led teams and supported mission-critical operations. He holds an M.S. in finance from the University of Notre Dame, an MBA from The College of William & Mary, and a B.S. in business administration with a concentration in economics and finance from the University of South Carolina Upstate.

-
This information is for informational purposes only and does not constitute investment advice.
Sources:
GDP – U.S. Bureau of Economic Analysis via FRED®
Employment & Inflation – U.S. Bureau of Labor Statistics via FRED®
Interest Rates – Board of Governors of the Federal Reserve System (US) via FRED®
S&P 500 – S&P Dow Jones Indices LLC via FRED ®
Market data – YCharts
Non-Deposit investment products and services, and Insurance products and services offered through United
Community Insurance, an independent insurance agency, are:- NOT Insured by FDIC or Any Other Government Agency;
- NOT Guaranteed by United Community Bank or any affiliate of United Community Bank;
- NOT a Deposit or Obligation;
- Subject to Risk and May Lose Value
This content is not intended as, and shall not be understood or construed as, financial advice, investment advice, or any other advice. This content is provided for informational purposes only, without any express or implied warranty of any kind, including warranties of accuracy, completeness, or fitness for any particular purpose. United Community Bank shall not be liable for any damages of any kind relating to such information not as to the legal, regulatory, financial or tax implications of the matters referred herein. All views and opinions expressed are those of the writer/commentator and do not reflect the views or positions of United Community Bank. United Community Bank provides investment, administrative, and trustee services to customers of United Community Bank